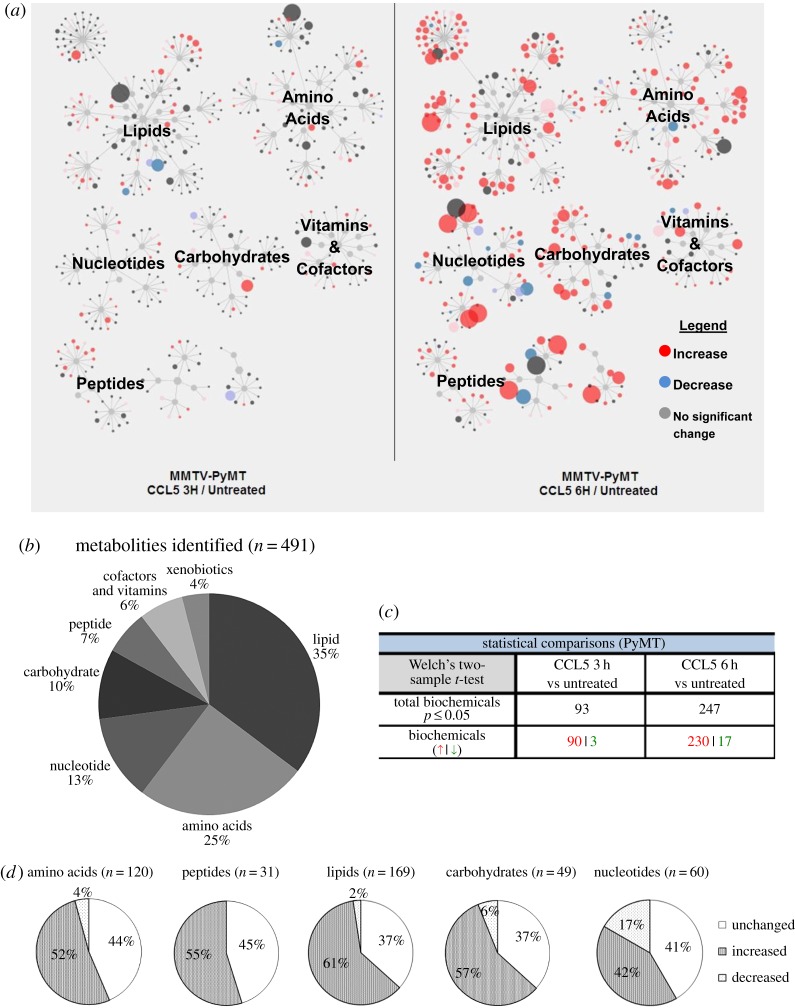
Figure 6.
Metabolic signature of CCL5-treated MMTV-PyMT primary mouse breast cancer cells reflects increased anabolic metabolism. MMTV-PyMT cells were treated with medium alone or 10 nM CCL5 for 3 or 6 h (n = 4 for each treatment). Cells were pelleted by centrifugation and stored frozen for transfer to Metabolon. (a) Schematic diagram illustrating the fold-change of metabolites in different metabolic pathways in MMTV-PyMT mouse breast cancer cells after 3 and 6 h of CCL5 treatment. The size of the circle indicates the degree of change. The colour indicates the direction of the change in flux, as indicated. (b) In total, 491 metabolites were identified, grouped according to their classification and as a percentage of the total number identified. (c) Welch 2-sample t-tests were used to identify metabolites whose levels changed significantly upon CCL5 treatment at the indicated times, relative to their levels in untreated cells (p < 0.05). Red indicates an increase in expression and green, a decrease. (d) Pie chart distinguishing changes in levels of metabolites following 6 h of CCL5 treatment.

