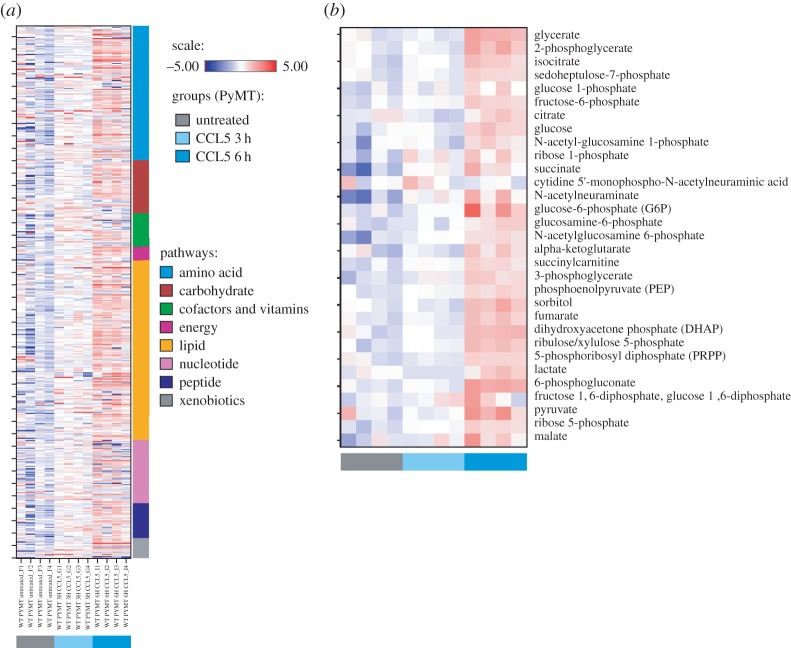
Figure 7.
Heat maps reveal a metabolic signature in CCL5-treated MMTV-PyMT primary mouse breast cancer cells. (a) Heat map showing hierarchical clustering of metabolic flux in MMTV-PyMT cells treated with CCL5 for 3 and 6 h (four replicates per each treatment group for a total of 12 samples). The Y-axis is clustered according to metabolic pathways. (b) Plotted in the heat map is a hierarchical clustering of glycolytic metabolites affected by CCL5 treatment.

