
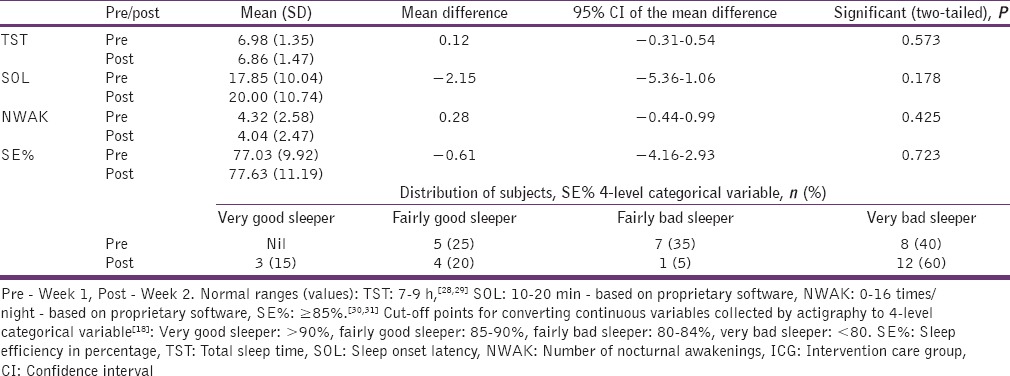
Table 4.
Comparisons of SE%, TST, SOL and NWAK mean scores in actigraphy assessments at two time points in the ICG (n=20)
Official websites use .gov
A
.gov website belongs to an official
government organization in the United States.
Secure .gov websites use HTTPS
A lock (
) or https:// means you've safely
connected to the .gov website. Share sensitive
information only on official, secure websites.
Comparisons of SE%, TST, SOL and NWAK mean scores in actigraphy assessments at two time points in the ICG (n=20)