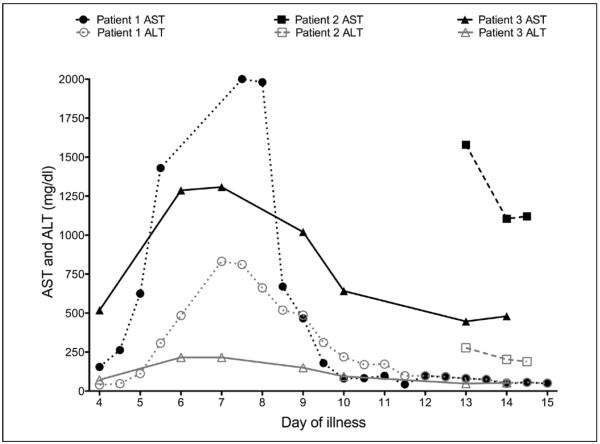
Figure 4.
Graphic presentation of liver enzymes levels throughout the critical care period of patients with Ebola virus disease. Black lines represent serum aspartate aminotransferase (AST), and gray lines represent serum alanine aminotransferase (ALT). Patient 1 data are shown with closed circles (AST) and open circles (ALT). Patient 2 data are shown with closed squares (AST) and open squares (ALT). Patient 3 data are shown with closed triangles (AST) and open triangles (ALT).

