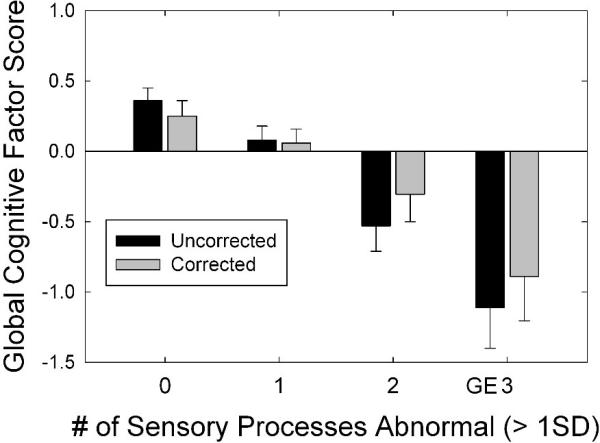
Figure 2.

The Global Cognitive Factor Score plotted as a function of the number of sensory measures that were “abnormal” (by more than on standard deviation from the mean) from the reanalysis of auditory and visual data alone obtained from older adults by Humes et al. (2013). Bars represent mean factor scores and the associated error bars depict 1 standard error.
