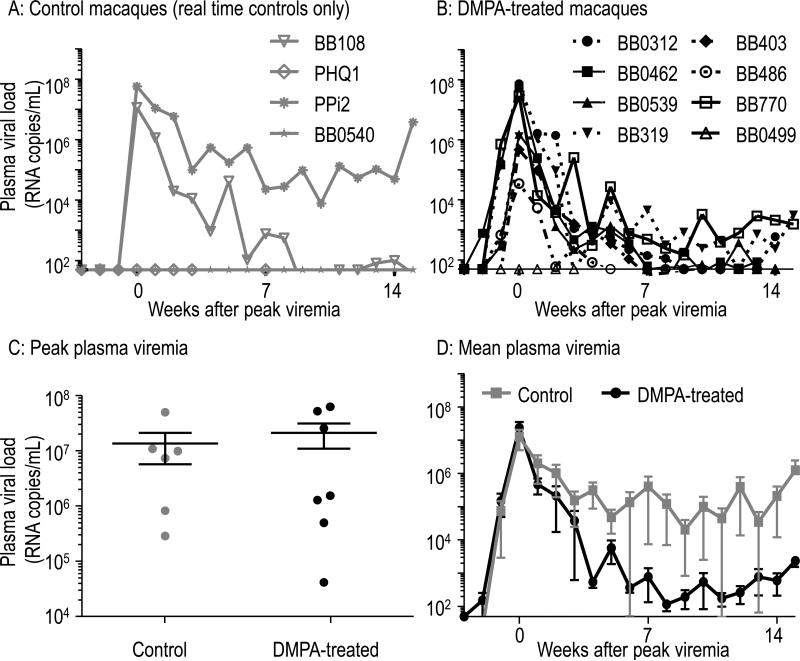
Fig. 2.
Course of SHIV infection in controls or DMPA-treated macaques. A, B: Figures show plasma viremia (RNA copies/mL, determined by in-house real-time PCR assay) in both SHIV-infected control or DMPA-treated macaques. DMPA treatment was continued after infection. Three macaques remained uninfected (B0499, PHQ1, BB0540). The detection limit was 49 copies/mL. Viremia was aligned at peak. C: Comparison of peak viremia in infected animals. The black line represents median values. The difference in distribution of peak values was not statistically significant (p=0.94, Mann-Whitney U test). D: Mean viremia is shown of infected animals, including data from four infected historic controls.

