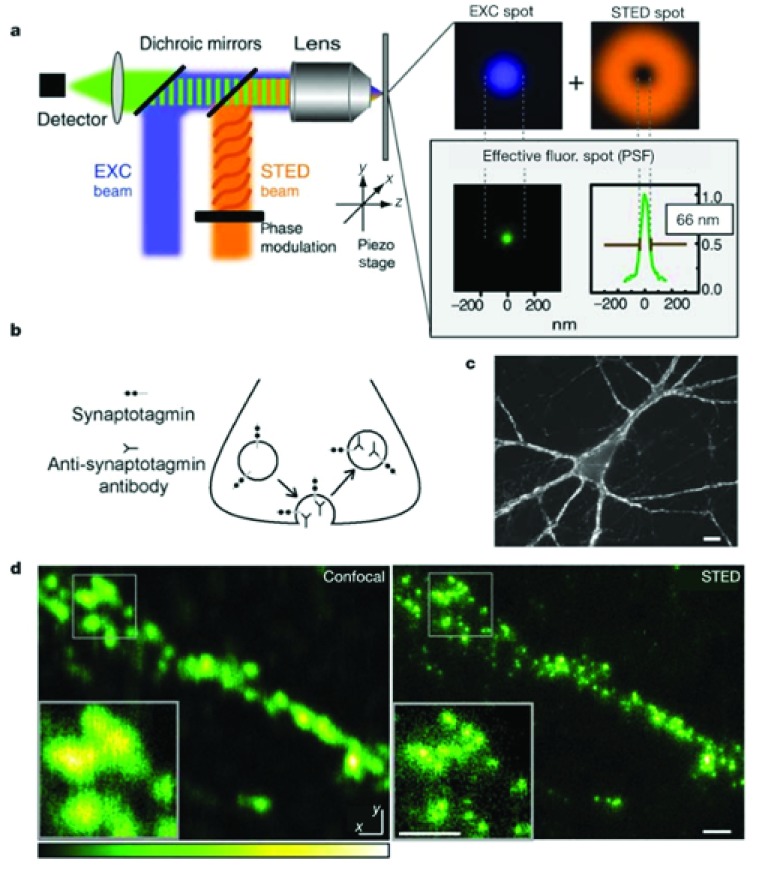
Figure 1. Stimulated emission-depletion (STED) microscopy resolves synaptic vesicles in individual boutons of primary cultured hippocampal neurons.
( a) Principles of operation. While the blue excitation (EXC) beam is focused to a diffraction-limited excitation spot, shown in the adjacent panel in blue, the orange STED beam is able to de-excite molecules. The STED beam is phase-modulated to form the focal dounut shown in the top right panel. Superimposition of the two focal spots confines the area in which fluorescence is possible to the dounut center, yielding the effective fluorescent spot of subdiffraction size shown in green in the lower panel. All spots represent measured data and are drawn to scale. The profile of the green effective fluorescent spot has a full width at half maximum of 66 nm as well as a sharp peak. The green spot shows an 11-fold reduction in focal area beyond the excitation diffraction value (compare with blue spot). ( b) Mechanism of synaptic labeling. Synaptic vesicles exocytose, allowing their lumenal synaptotagmin domains to bind anti-synaptotagmin antibodies. These antibodies are internalized upon endocytosis. ( c) Typical image of a neuron labeled with an anti-synaptotagmin antibody, fixed, permeabilized, and visualized by using Atto532-labeled secondary antibodies. Fluorescent puncta represent labeled synaptic nerve terminals. Scale bar = 10 mm. ( d) Comparison of confocal (left) and STED (right) counterpart images of a labeled preparation reveals a marked increase in resolution by STED. Scale bar = 500 nm. PSF, point spread function. Taken from 11.

