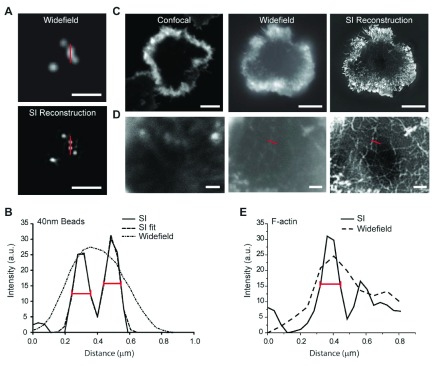
Figure 2. Structured illumination (SI) microscopy permits super-resolution imaging of F-actin at the natural killer cell synapse.
( a) Widefield (top) and SI images (bottom) of 40 nm beads. Bar = 1 μm. ( b) Plot profiles from the region marked by red bars in ( a) show that two beads approximately 200 nm apart can be resolved only following SI reconstruction. Fitting of the curve with two Gaussians gives full widths at half maximum (FWHMs) (red bars on the graph) of 99 and 105 nm for each bead, respectively. ( c) Confocal (left), widefield (middle), and SI image (right) of human primary natural killer cells activated on a surface coated with anti-NKG2D monoclonal antibody. Bars = 5 μm. ( d) Regions at the center of the synapses in ( c) are enlarged to demonstrate the increased level of detail in cortical F-actin structure when SI microscopy is used. Bars = 1 μm. ( e) Plot profiles to directly compare the widefield and SI reconstructed image for the region indicated by the red bar shown in ( d). Estimation of the FWHM (red bar on the graph) from the Gaussian fit of the SI data gives a resolution of approximately 115 nm. a.u., arbitrary units. Taken from 19.

