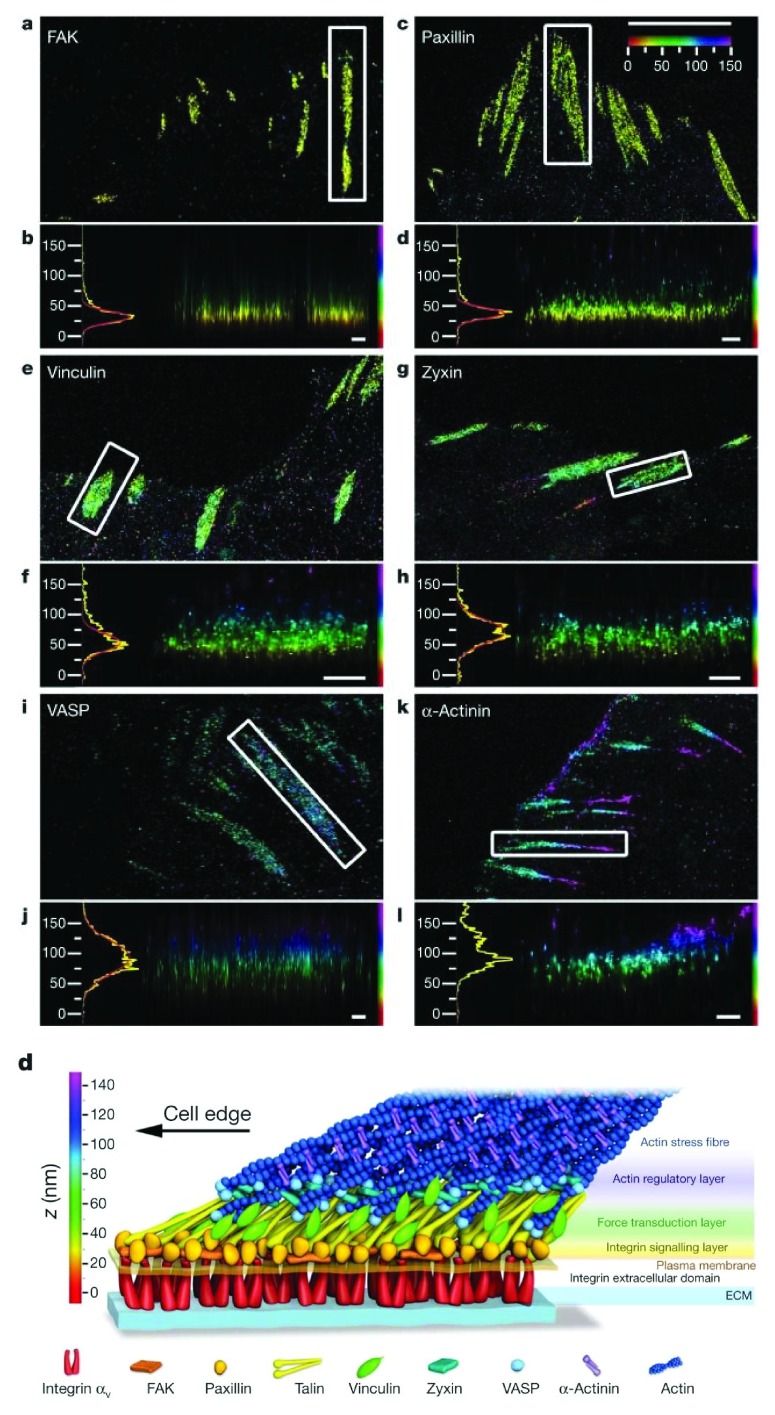
Figure 4. Protein stratification of the focal adhesion core.
Top view and side view “interferometric” photo-activated localization microscopy (iPALM) images of focal adhesions (white boxes, top-view panels) and corresponding z histograms and fits. ( a, b) FAK. ( c, d) Paxillin. ( e, f) Vinculin. ( g, h) Zyxin. ( i, j) VASP. ( k, l) Alpha-actinin. The vertical distribution of α-actinin is non-Gaussian, so the focal adhesion peak fit is not shown. Paxillin and α-actinin shown are C-terminal photo-activatable fluorescent protein (PA-FP)-tagged. Colors: vertical ( z) coordinate relative to the substrate ( z = 0 nm, red). (d, bottom panel). Schematic model of focal adhesion molecular architecture depicts experimentally determined protein positions. Note that the model does not depict protein stoichiometry. Scale bars = 5 μm (a, c, e, g, i, k) and 500 nm (b, d, f, h, j, l). ECM, extracellular matrix. Taken from 50.

