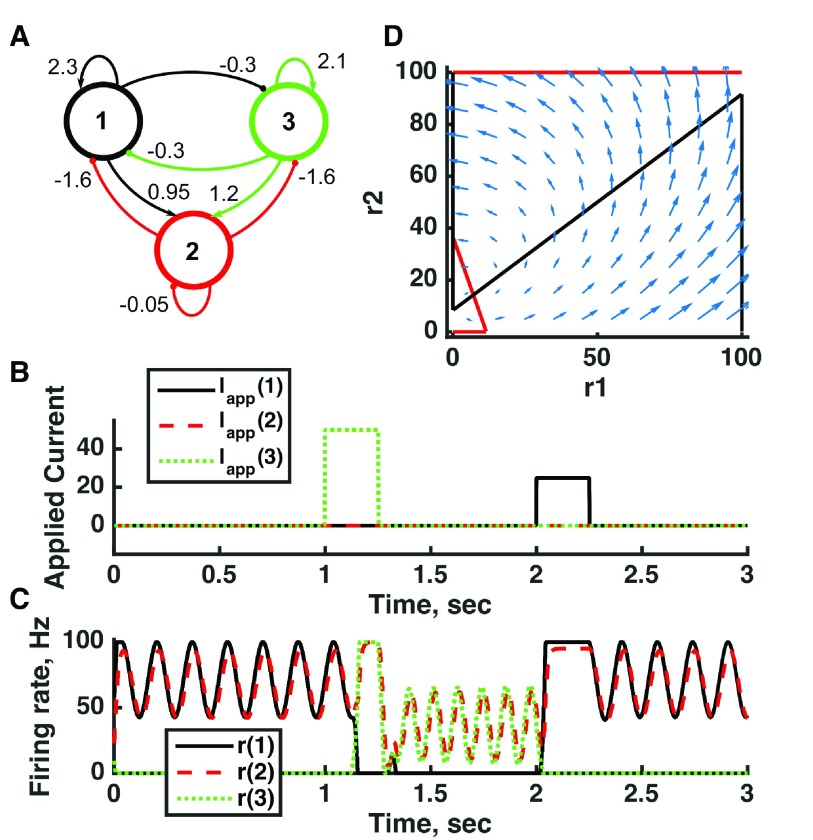
Figure 7. Switching between two distinct oscillators in a bistable threshold-linear three-unit circuit.
( A) Diagram of the model circuit. Arrows indicate excitatory connections, and balls indicate inhibitory connections between units. Architecture is identical to that of Figure 4. ( B) Applied current as a function of time. The first current pulse is applied to unit 3, and the second is applied to unit 1. ( C) Firing rate as a function of time in the coupled network. The current steps switch activity between two stable states with different frequencies of oscillation. ( D) Any particular combination of the firing rates of the three units (x-axis is rate of unit 1, y-axis is rate of unit 3) determines the way those firing rates change in time (arrows). Only a plane out of the full three-dimensional space of arrows is shown: the plane corresponding to dr(3)/dt = 0. Red line: nullcline for unit 2—the value of r(2) at which dr(2)/dt = 0 (its fixed point) given a value of r(1). Black line: nullcline for unit 1—the value of r(1) at which dr(1)/dt = 0 (its fixed point) given a value of r(2). The crossing points of the nullclines are fixed points of the whole system, none of which is stable in this example. For parameters, see supporting Matlab code, “dynamics_three_units.m”.

