
Figure 3. Representative P–V loops from TG lines .
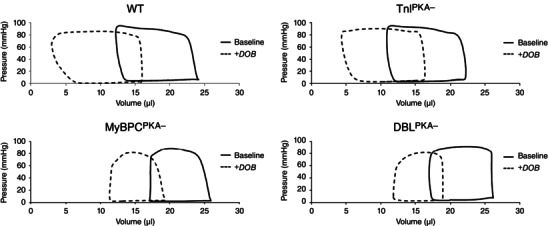
Representative P–V loops from WT, TnIPKA−, MyBPCPKA− and DBLPKA‐ mice. Representative loops were averaged from at least 10 P–V loops before (solid trace) and after (dashed trace) dobutamine administration for each animal.