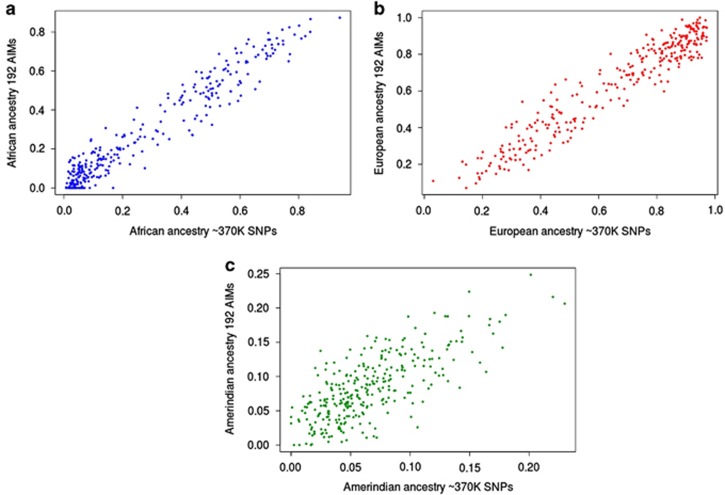
Figure 4.
Comparison between the genetic ancestry inferred by ~370 K SNPs and genetic ancestry inferred by 192 SNPs at the individual level. Graphic representations comparing genetic ancestry inferred by AIM panel or by the ‘gold standard' (~370 K SNPs). For this representation, we randomly selected a subset of 100 individuals from each cohort. (a) Correlation structure for African ancestry; (b) correlation structure for European ancestry; and (c) correlation structure for Amerindian ancestry.

