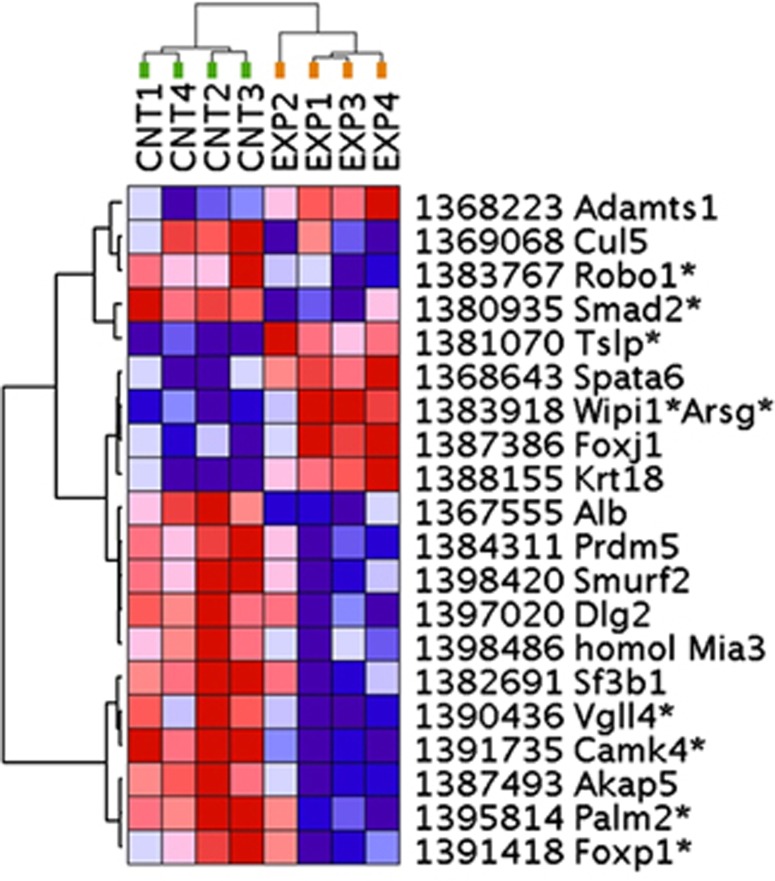
Figure 1.
Differentially expressed transcripts in the MK801 treatment. Transcripts were subjected to a two-way (horizontal: genes; vertical: samples) unsupervised clustering using GenePattern and Euclidian distance calculations. Individual genes are denoted by microarray probe numbers and gene symbols, *indicates when a transcript is in close physical proximity of a gene. Gene expression differences are color-coded (red—increased expression; blue—decreased expression), and the intensity of the color corresponds to the magnitude of gene expression change. Note that this panel of genes separates the experimental and control samples into two distinct clusters.

