Figure 3.
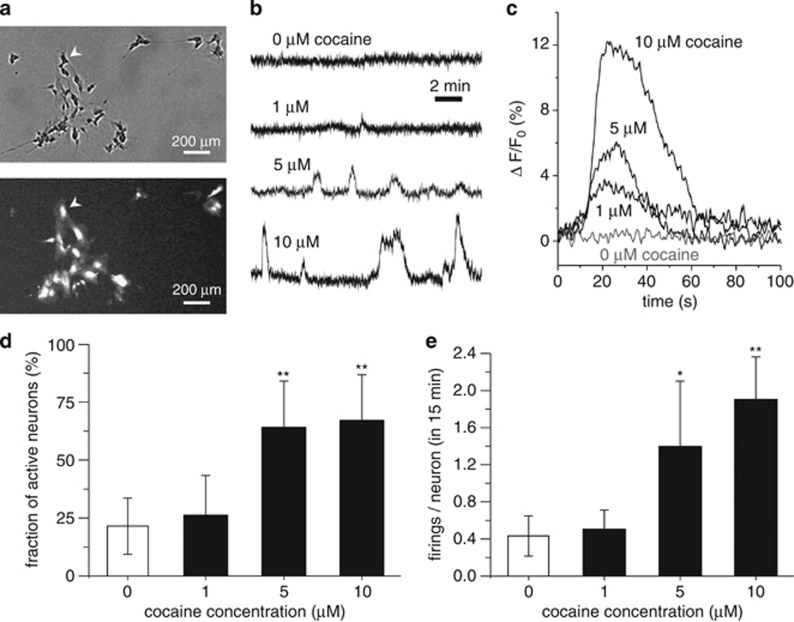
Neuronal activity changes induced by cocaine. (a) Comparison of a phase-contrast snapshot (top) with the fluorescence equivalent (bottom). For the latter, bright spots are firing neurons, showing the ability to track neuronal activity with single-cell resolution. The arrowhead indicates the same neuron in both images. (b) Representative fluorescence traces of neuronal activity for gradual exposure to higher cocaine concentrations. Neuronal response is weak for 1 μM concentration, and increases progressively for 5 and 10 μM. (c) Detail of neuronal response to cocaine, showing that the firing amplitude increases with cocaine concentration. Each trace at a given concentration is an average over the responses of 10 different neurons. (d) Comparison of the fraction of active neurons, showing that network activity significantly increases for 5 and 10 μM cocaine exposure compared to the 0 μM (spontaneous acitivity) and 1 μM concentration. (e) Average number of activations per neuron for the different conditions, highlighting the much higher neuronal activity at 5 and 10 μM cocaine. Significant differences compared to 0 μM cocaine are indicated. *P<0.05 and **P<0.01. Error bars indicate s.d.

