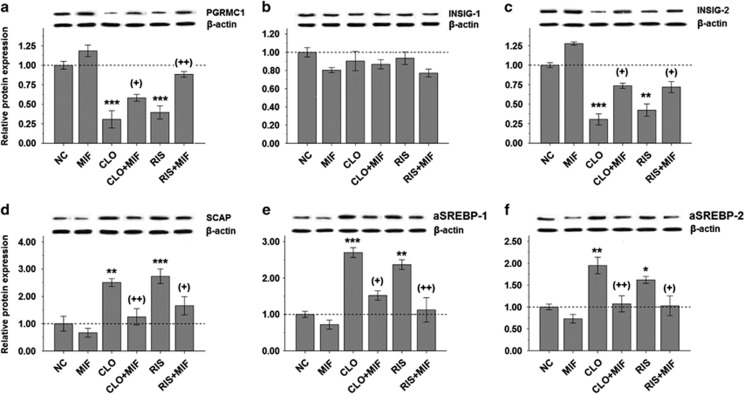
Figure 4.
Comparisons of hepatic expression of PGRMC1/INSIG/SCAP/SREBP protein in CLO- or RIS-treated rats before and after the add-on MIF treatment using western blotting: (a) PGRMC1, (b) INSIG-1, (c) INSIG-2, (d) SCAP, (e) SREBP-1 and (f) SREBP-2. *P<0.05, **P<0.01 and ***P<0.0001 as compared with controls. +P<0.05 and ++P<0.01 in parentheses as compared with corresponding AAPD monotherapy group. Relative expression data were normalized from β-actin protein level. ARI, aripiprazole; CLO, clozapine; CLO+MIF, clozapine with add-on MIF treatment; HAL, haloperidol; MIF, mifepristone; NC, normal control; RIS, risperidone; RIS+MIF, risperidone with add-on MIF treatment.

