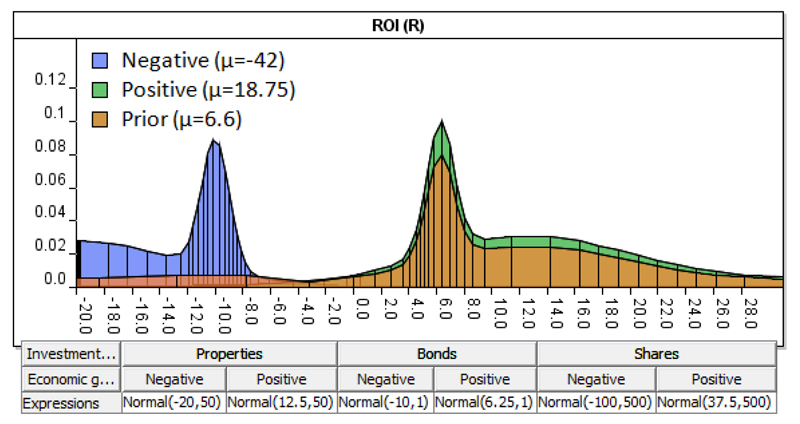
Figure 9.
The distributions under Negative and Positive economic growth, superimposed against the prior distribution, based on the Model of Figure 6, and by taking into consideration the new hypothetical CPT (which also preserves data expectations) presented below the figure.

