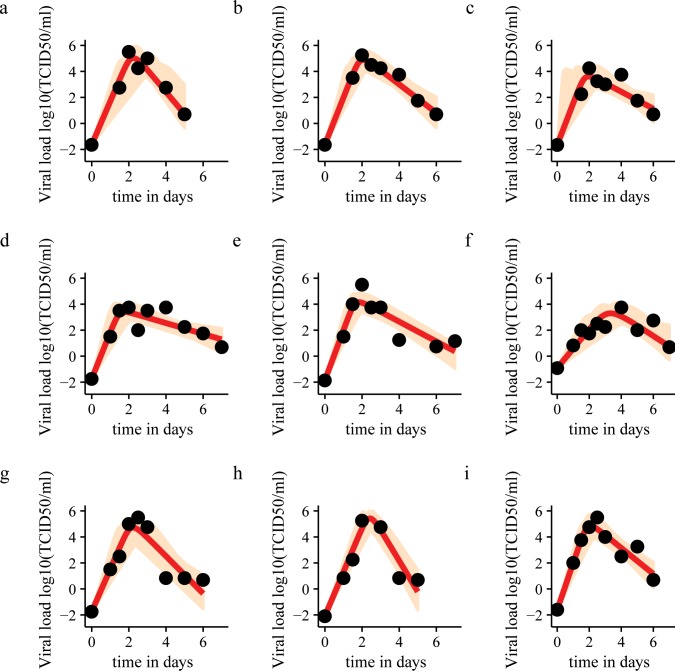
Fig 2. Model fit to data for nine patients.
Black dots: viral load data points. Red line: model fit based on median estimates. Light brown area: sample from posterior distributions of viral dynamics. Patients 2 and 3 have a missing data point at day 1. Accordingly, there is great uncertainty about the time of the viral load peak, as illustrated by the sample from the posterior distribution.

