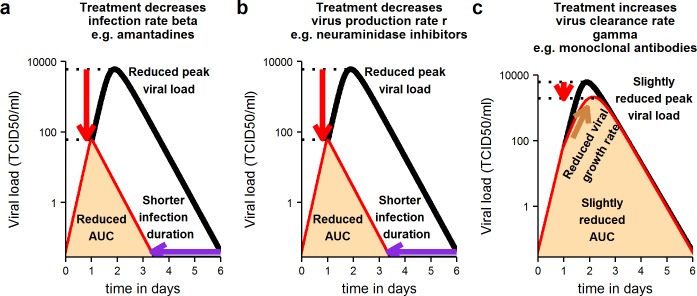
Fig 4. Schematic illustration of changes expected in key infection-related quantities in treated versus untreated individuals (treated before time of peak viral load on day 1).
Treatments acting on the infection rate or viral production rate have a strong impact on infection, if given before the time of peak viral load (a, b). They reduce peak viral load, duration of infection and viral load area under the curve (AUC). Treatments acting on virus clearance have a weaker effect on the course of infection, if given before the time of peak viral load (c). Black line: viral load curve in untreated infection. Red line: viral load curve in treated infection. Fill indicates viral load area under the curve in treated infection.

