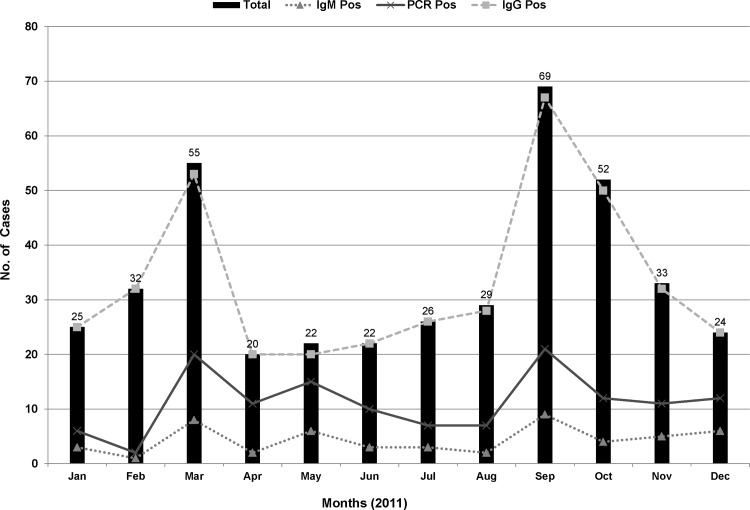
Fig 1. The distribution of HCMV positive cases in study population during 2012.
The months are given on X-axis. The data labels on Y-axis indicate the number of total and positive cases across the year. The solid black line indicates total number of cases while the number of positive cases for each assay indicated with different bar-style.

