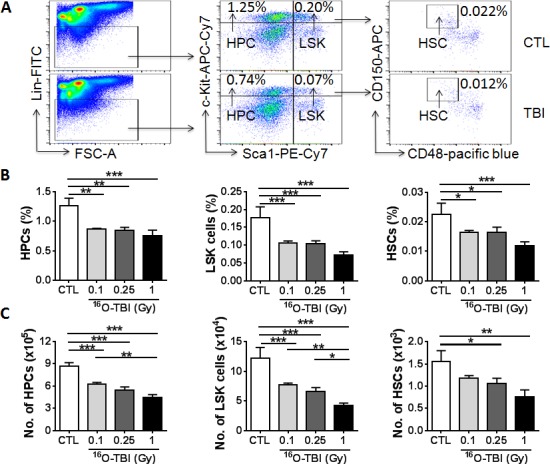
Fig 2. 16O TBI causes reductions in numbers of HPCs and HSCs at two weeks after irradiation in a radiation dose dependent manner.

(A) Representative gating strategy of flow cytometric analysis for HPCs (Lin-Sca1-c-kit- cells), LSK cells (Lin-Sca1+c-kit+cells) and HSCs (Lin-Sca1+c-kit+CD150+CD48- cells) in BMCs is shown from 1.0 Gy 16O TBI and sham-irradiation (CTL). (B and C) Frequencies (panel B) and total numbers (panel C) of HPCs, LSK cells and HSCs from each mouse are presented as mean ± SD (n = 5). The statistical significance for the difference between the control group and each of the irradiated groups is indicated by asterisks. *p<0.05, **p<0.01, ***p<0.001 as determined by one-way ANOVA.
