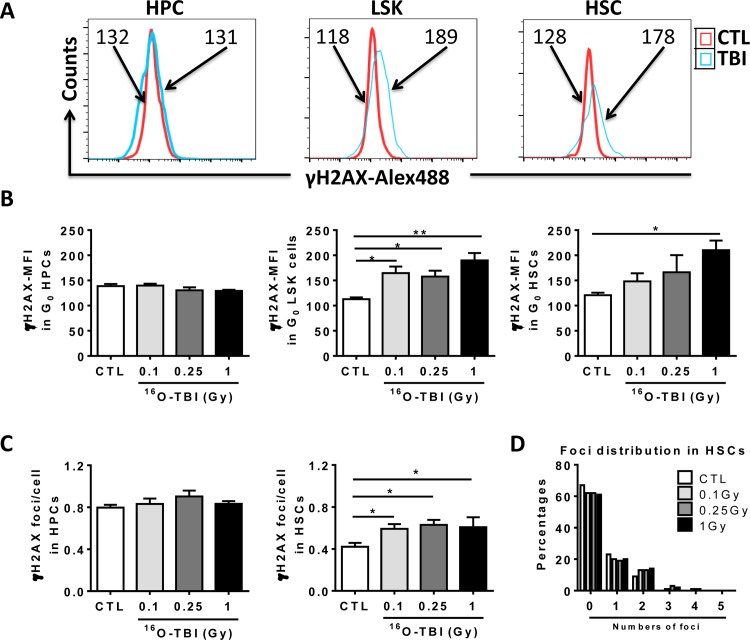
Fig 6. 16O TBI causes persistent increases in DNA damage in HSCs but not in HPCs two weeks after the exposure.
(A) Representative analysis of DNA damage measured in Lin- cells by flow cytometry using γH2AX staining in BM HPCs and HSCs from control and 1.0 Gy16O TBI mice. The histograms indicate γH2AX MFI from a representative experiment. (B) The γH2AX MFI in BM HPCs and HSCs after TBI are presented as mean ± SD. (C) Sorted HPCs and HSCs from irradiated and non-irradiated mice were stained with γH2AX antibody. The numbers of foci in each cell were counted and expressed as mean ± SD. (D) The distribution of foci was expressed as the percentages of different numbers of foci in control and irradiated HSCs. The statistical significance for the difference between the control groups and each of irradiated groups is indicated by asterisks. *p<0.05, **p<0.01 by one-way ANOVA analysis.

