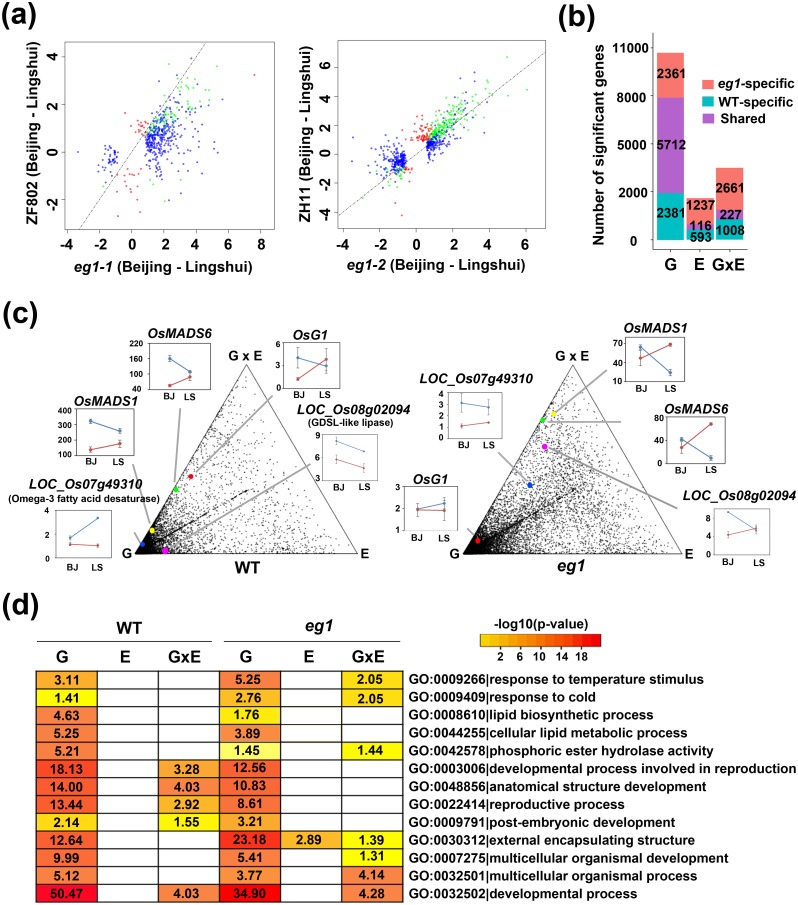
Fig 6. Genotype (G), environment (E) and genotype-environment interaction (GxE)-dependent gene expressional variations of eg1.
(a) Scatterplots of comparisons of environmentally responsive genes between eg1 alleles and wild-types. x and y axes are values of log2 [ratios of gene expression in Beijing to that in Lingshui] of two genotypes respectively. Points represent wild-type-specific (red), eg1-specific (blue) and shared (green) genes. Dotted lines indicate y = x lines. (b) Comparisons of genes significantly affected by G, E and GxE in wild-type and eg1. Effects were analyzed by two-way ANOVA. (c) Triangular scatterplots of distributions of genes significantly affected by G, E and GxE in wild-type and eg1. Each dot indicates a gene, and the three vertexes of triangle indicate three factors G, E, GxE respectively. The closer distance between a gene and a vertex means the stronger effect of the factor on the gene. Insets show expressions of some representative genes in ZF802/eg1-1 (blue lines) and ZH11/eg1-2 (red lines) of Beijing (BJ) and Lingshui (LS). Effects were analyzed by two-way ANOVA. (d) Comparisons of thirteen major pathways affected by G, E and GxE in wild-type and eg1. Numbers in boxes indicate -log10 (P-value) of the pathway enrichment tested by Fisher's exact test with Bonferroni correction and blank boxes no statistical significance.

