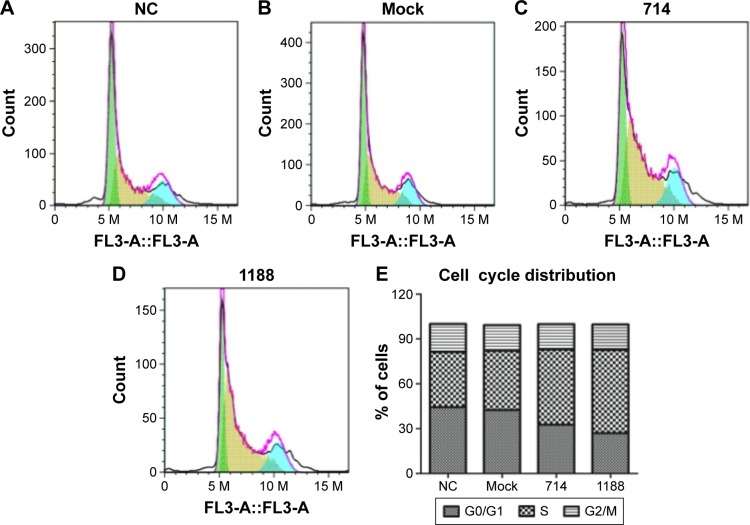
Figure 3.
Effect of knockdown Wnt3 on the cell cycles of gastric cells.
Notes: (A–D) Flow cytometry analysis of cell cycle distribution in MGC-803 after transfected with control, mock, Wnt3-714-siRNA, or Wnt3-1188-siRNA for 48 hours. (E): The percentages of cells in the G0/G1, S, G2/M phases of the cell cycle in each group were measured by using the CellQuest Pro software. The values in each group represent the average values from three samples. FL3-A indicates that the fluorescence signal was detected by FL3 channel in FACS analysis.
Abbreviations: FACS, fluorescence-activated cell sorting; NC, control-siRNA group; siRNA, small interfering RNA.

