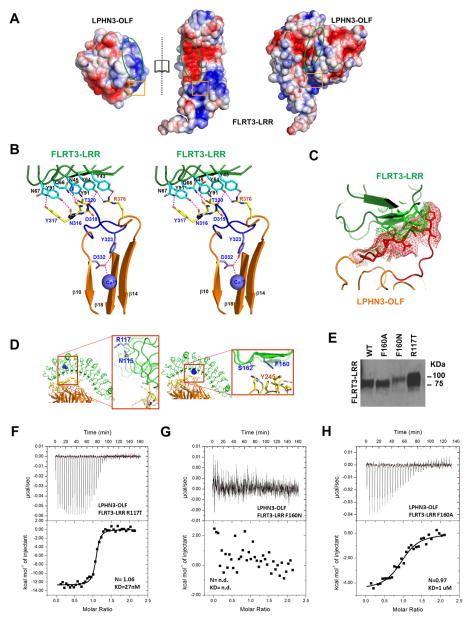
Figure 5. Analyses of the LPHN3-OLF/FLRT3-LRR association.
(A), Electrostatic surface of LPHN3-OLF and FLRT3-LRR in “open book view” to emphasize a charge complementarity within the main interfacing area of both partners (green oval) and a repulsive facing area (orange square). (B), Stereoview of the stabilization of the LPHN3-OLF loop 316–329 in the complex. Interfacing LPHN3-OLF and FLRT3-LRR residues are represented in yellow and cyan respectively, and the potential hydrogen bonds are shown as dashed magenta lines. Loop 316–329 (closed conformation) with the Tyr323, Asp332 residues and Ca2+ are in shown in purple. The central pore β-strands β10, β14 and β18 involved in the Ca2+ binding and the β13-β14 connecting loop that lies on top of the 316–329 loop are also shown in orange. (C), Loop 316–329 in the open state (C2221) of LPHN3-OLF from a superimposition with the complex structure. Red and green mashes represent the molecular surfaces of the residues that would display a steric clash. (D–H), Analyses of the binding between LPHN3-OLF/FLRT3-LRR by site-directed mutagenesis on FLRT3-LRR (D), Models showing the overall position of the mutations. (E), Western blot showing the FLRT3-LRR mutants used in this figure and their different migration pattern due to the additional glycosylation. (F), ITC experimental trace of the LPHN3-OLF injected at 100μM into the cell containing the FLRT3-LRR R117T control mutant at 10μM. (G), ITC experimental trace of the LPHN3-OLF injected at 100μM into the cell containing the FLRT3-LRR F160N mutant at 10μM. This mutant has an additional N-linked glycosylation site at the OLF binding surface that prevents the association. (H), ITC experimental trace of the LPHN3-OLF injected at 100uM into the cell containing the FLRT3-LRR F160A mutant at 10μM.

