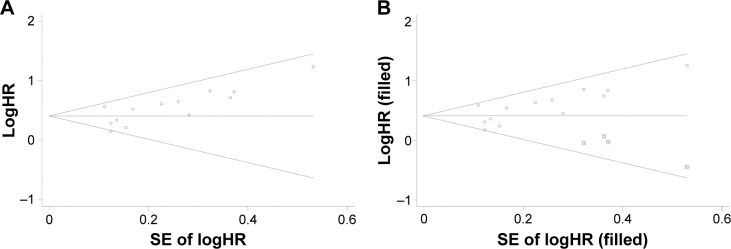
Figure 5.
Funnel plot of included studies reporting OS in GC patients.
Notes: (A) Begg’s funnel plot for the assessment of potential publication bias; (B) funnel plot adjusted with trim and fill method. Circles: included studies. Squares: presumed missing studies.
Abbreviations: OS, overall survival; GC, gastric cancer; HR, hazard ratio; SE, standard error.

