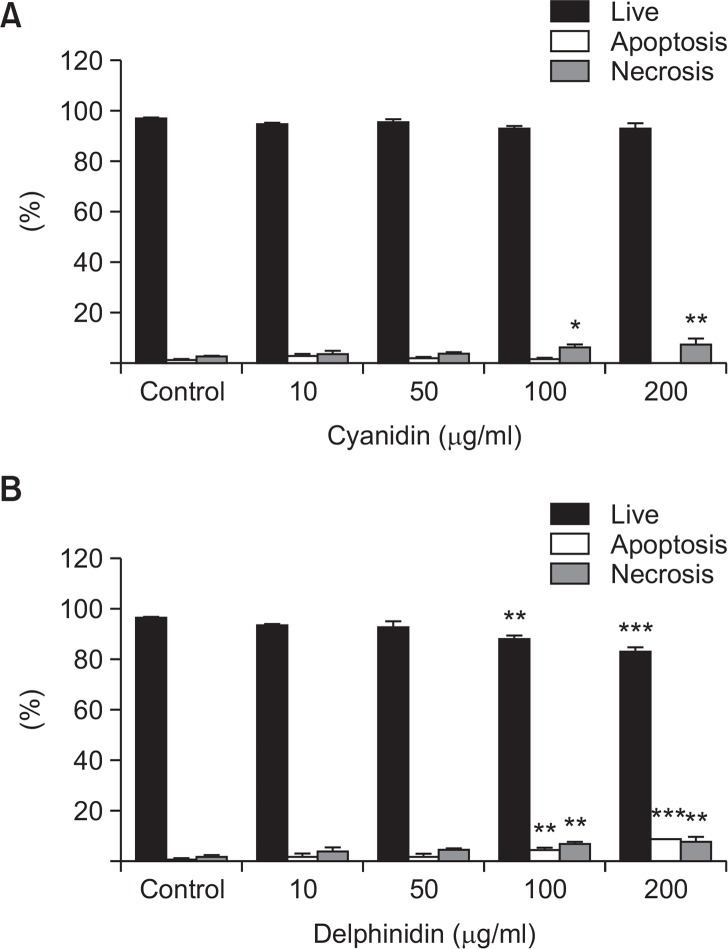
Fig. 1.
Cell viability was assessed using Annexin V and PI double staining method. (A) There was no statistically significant difference in cell viability between the control group and the cyanidin subgroups at any of the studied concentrations (*p<0.05, as compared to the control). (B) There was no statistically significant difference in cell viability between the control group and the delphinidin subgroups at concentrations of 10 and 50 μg/ml. However, significant reductions in cell viability were noted in the delphinidin concentrations of 100 μg/ml and 200 μg/ml (**p<0.01 and ***p<0.001, as compared to the control).

