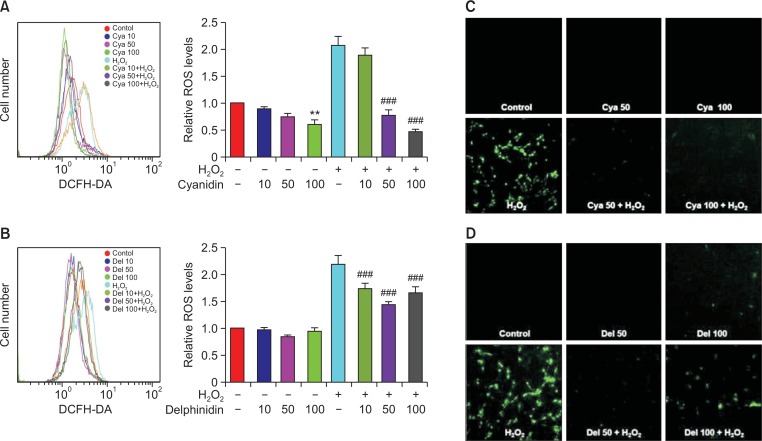
Fig. 3.
(A, B) Intracellular ROS levels were significantly higher in the H2O2 group, as compared with the control. Intracellular ROS levels in the cyanidin-H2O2 and the delphinidin-H2O2 subgroups were lower than in the H2O2 group. The graph represents the mean ± SD of 3 independent experiments (**p<0.01 compared to control group; ###p<0.001 compared to H2O2 group). (C, D) According to the morphological analyses using a confocal microscope, intracellular ROS levels were higher in the H2O2 group than in the control; however, ROS levels were markedly lower in the cyanidin-H2O2 and the delphinidin-H2O2 subgroups than in the H2O2 group. Cya: Cyanidin, Del: Delphinidin.

