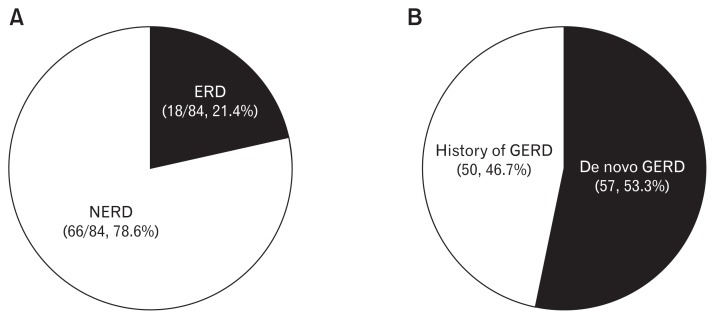
Figure 1.
The distribution of gastroesophageal reflux disease (GERD) according to classification. (A) The proportion of erosive reflux disease (ERD) and non-erosive reflux disease (NERD) in GERD patients with esophagogastroduodenoscopy (EGD) (n = 84). (B) The proportion of de novo GERD in patients with GERD (n = 107).

