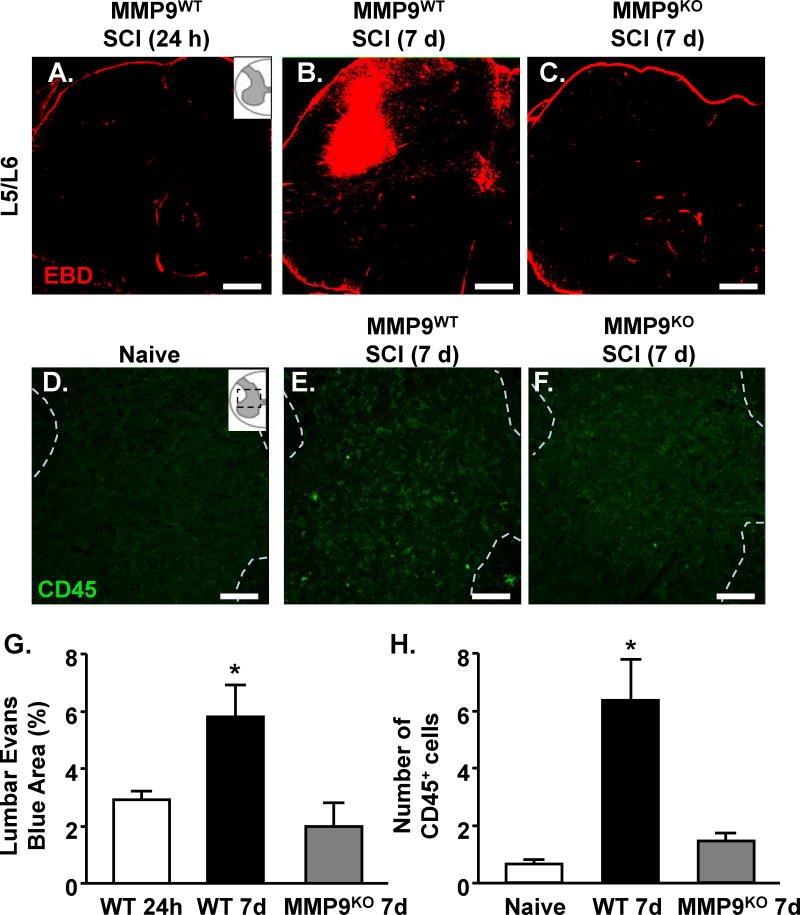
Figure 7. MMP-9-dependent breakdown of the lumbosacral vasculature 7 days after thoracic SCI.
MMP9WT or MMP9KO mice were naïve or subjected to a thoracic SCI. Mice were injected with evans blue dye (EBD) as naive, and at 24 h or 7 d after SCI. Mice were perfused 30 minutes after injection, fixed, and the spinal cord was collected. Vascular permeability was described via fluorescence using confocal microscopy. Representative images of evans blue labeling in L5/L6 of the lumbar cord of A) MMP9WT 24 h, B) MMP9WT 7 day, and C) MMP9KO 7 day mice. D) Quantification of evans blue labeling through the lumbar cord. Bars represent the mean + SEM. Means with (*) are significantly different from 24 h. The same mice were labeled for CD45 expression in the lumbar cord. Representative images of CD45 labeling in lumbar cord of E) naïve, F) MMP9WT 7 days, and G) MMP9KO 7 day mice. The number of CD45 positive cells is quantified in H. Bars represent the mean + SEM. Means with (*) are significantly different from naive. Data were analyzed using one-way ANOVA and Tukey's HSD post hoc tests for significant main effects (n=5-7). Inserts show the anatomical region within the spinal cord used. Scale bar is 100um.

