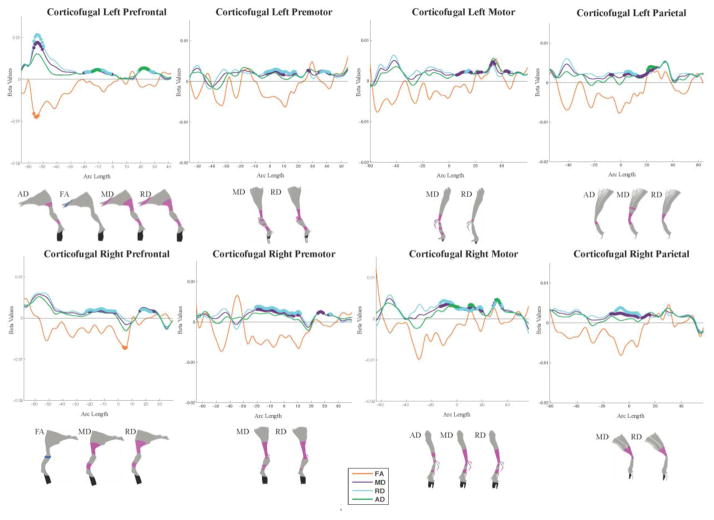
Figure 2.
Local differences in anisotropy and diffusivity along the corticofugal tracts. Beta plots show diffusion parameter values along the arc length of each fiber. Positive beta values correspond to higher diffusion or anisotropy in SSRI-exposed neonates and negative beta values correspond to lower diffusion or anisotropy in SSRI-exposed neonates. Colored circles indicate regions of significance post FDR correction. Significant points are also visualized on the fiber itself for each parameter. Magenta indicates significant positive beta values. Yellow indicates significant negative beta values. Black regions were not analyzed due to increased subject variability.

