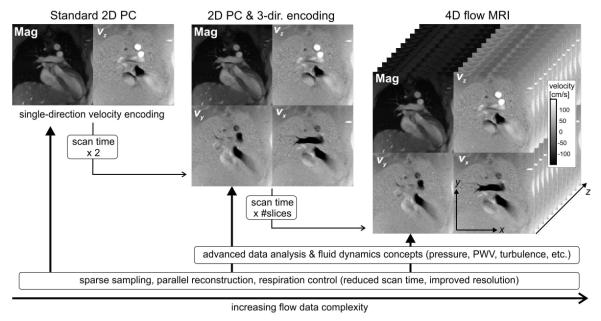
Fig. 2.
Chart illustrating the increased complexity and information content in flow data as a function of dimensionality and scan time. The role of methods development is shown along the bottom row, with an impact spanning standard 2D cine PC (left) to 4D flow MRI (right), with volumetric coverage and three-directional velocity encoding. Mag, magnitude image.

