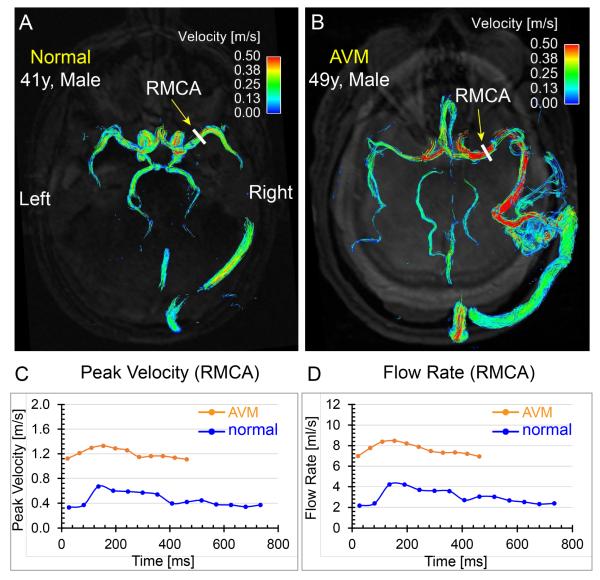
Fig. 9.
Comparisons of time-integrated 3D path lines and regional flow quantification between a 41-year-old male normal volunteer and a 49-year-old male patient with cerebral arteriovenous malformation (AVM). The path lines of the normal volunteer (a) show symmetric and coherent flow patterns in the cerebral arteries, whereas the path lines of the AVM patient (b) exhibit disturbed cerebral flow patterns and the velocity in the feeding right middle cerebral artery (RMCA) is much higher than the contralateral counterpart. The peak velocity (c) and flow-time (d) curves at the RMCA M1 segment (yellow arrows) quantitatively demonstrate higher blood flow and velocity in the AVM feeding artery compared to the same artery in the normal volunteer. Note that the average length of the cardiac cycle was shorter for the AVM patient compared to the normal volunteer during the scan.

