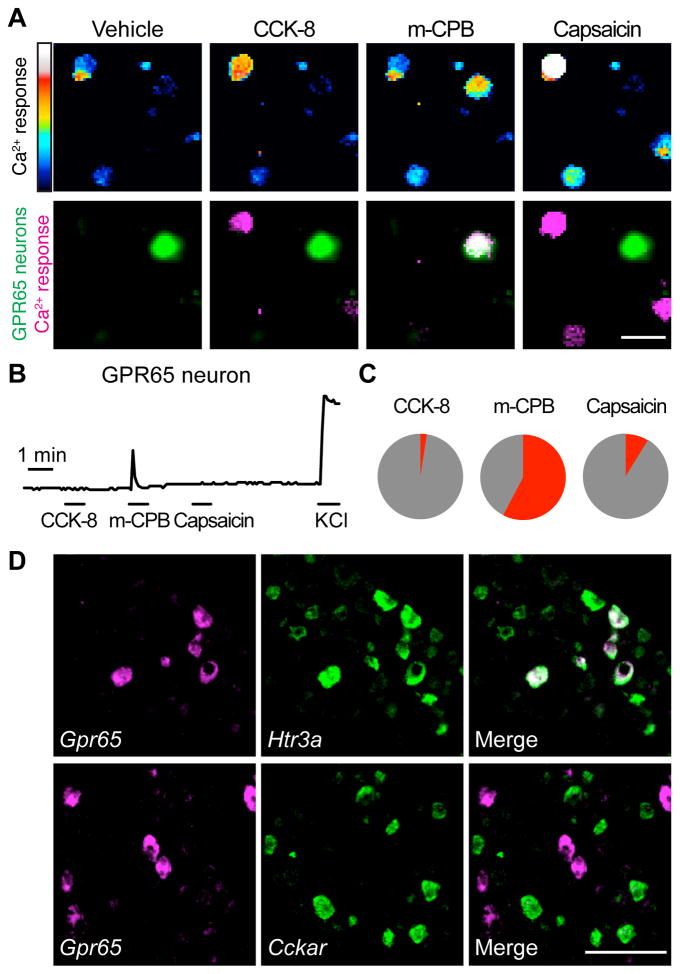
Figure 5. GPR65 neurons respond in vitro to an HTR3A agonist.
(A) Calcium responses by Fura-2 imaging of dissociated vagal sensory neurons from Gpr65GFP/+ mice to CCK-8 (10 nM), the HTR3A agonist m-chlorophenylbiguanide (mCPB, 100 μM) and capsaicin (1 μM), scale bar: 40 μm. Top: Fura-2 excitation; bottom: GFP fluorescence (green) and calcium responses (magenta). (B) Representative responses of a GPR65 neuron. (C) Pie chart indicating percentage of GPR65 neurons activated (red) by each ligand. (D) Two color FISH in vagal ganglia. Scale bar: 100 μm. See also Figure S6.

