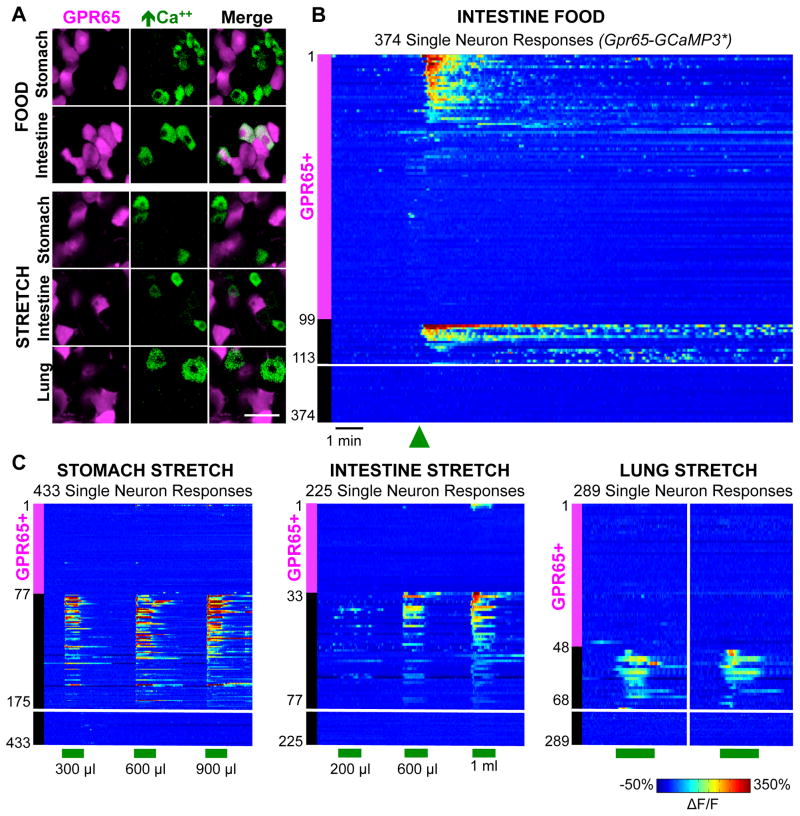
Figure 6. GPR65 neurons detect intestinal nutrients in vivo.
(A) In vivo imaging of vagal ganglia in Gpr65-GCaMP3* mice showing GCaMP3 responses (green) of GPR65 neurons (magenta) to stimuli indicated. (B) Rows indicate time-resolved responses (ΔF/F, color coded) of single neurons in Gpr65-GCaMP3* mice to stimuli (green bars: 15 seconds). Magenta and black bars represent tdTomato-positive and negative neurons. Only some unresponsive tdTomato-negative neurons are depicted; numbers at Y-axis base indicate total number of viable imaged neurons. See also Figure S6.

