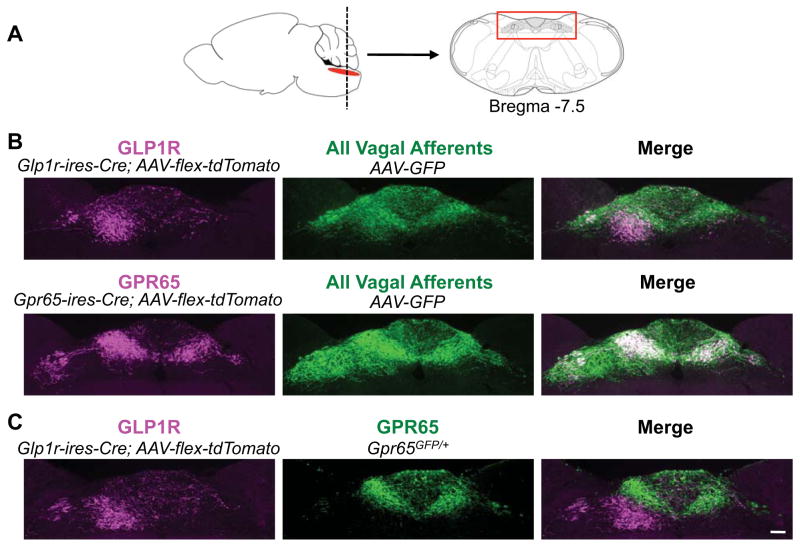
Figure 7. Visualizing brainstem innervation.
(A) Vagal sensory neuron axons were analyzed in a brainstem region (red box) containing the NTS and area postrema. (B) Vagal ganglia of Glp1r-ires-Cre and Gpr65-ires-Cre mice were infected with AAV-flex-tdTomato and AAV-GFP for immunofluorescence-based detection of Cre-containing (magenta) and all (green) vagal sensory neuron axon types. (C) Vagal ganglia of Glp1r-ires-Cre; Gpr65GFP/+ mice were infected with AAV-flex-tdTomato for simultaneous visualization of GLP1R (magenta) and GPR65 (green) axons, scale bar: 100 μm. See also Figure S7.

