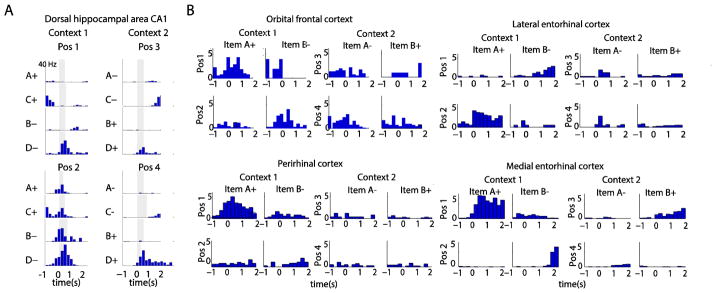
Figure 2.
Firing rate histograms illustrating example neurons with mixed selectivity in different brain regions. Each panel shows the response pattern of a neuron during the sampling of a specific object stimulus at a particular location in one of the two contexts. In each panel neural activity is time-locked to the onset of stimulus sampling (time = 0). (A) An example CA1 cell on the four object (A,B,C,D) version of the task. Gray bars indicate minimum object sampling period used in RSAs. (B) Example cortical cells recorded on the two object (A,B) version of the task.

