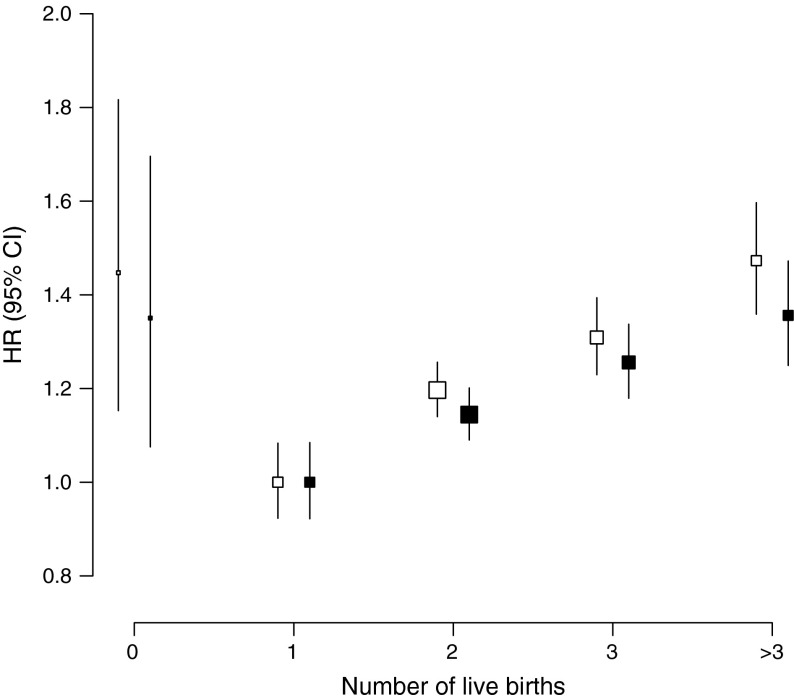
Fig. 3.
Adjusted HRs for incident diabetes associated with number of live births. Analyses are stratified by age and region (white squares, model I), and additionally adjusted for level of attained education, household income, smoking status, alcohol use, systolic blood pressure, history of hypertension, physical activity and BMI (black squares, model III). Conventions are the same as in Fig. 1

