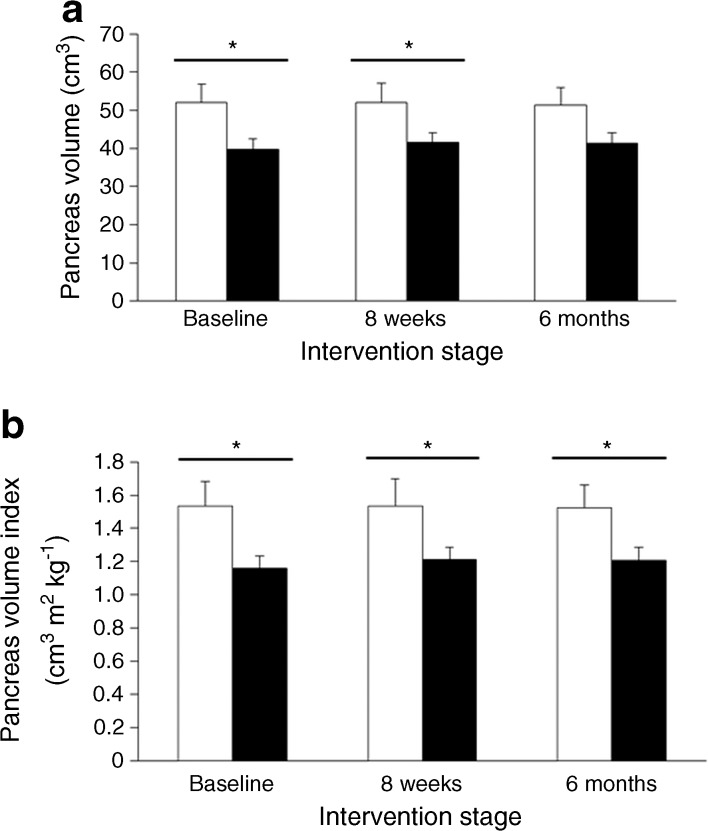
Fig. 1.
Difference in pancreas volume between the responder and non-responder groups at different stages of the study. (a) Absolute pancreas volume change between responders (white bars) and non-responders (black bars) at baseline, 8 weeks and 6 months. (b) Change in pancreas index (pancreas volume/BMI at baseline) between responders and non-responders at baseline, 8 weeks and 6 months. Error bars represent SEMs. *p < 0.05 as shown

