Fig. 1.
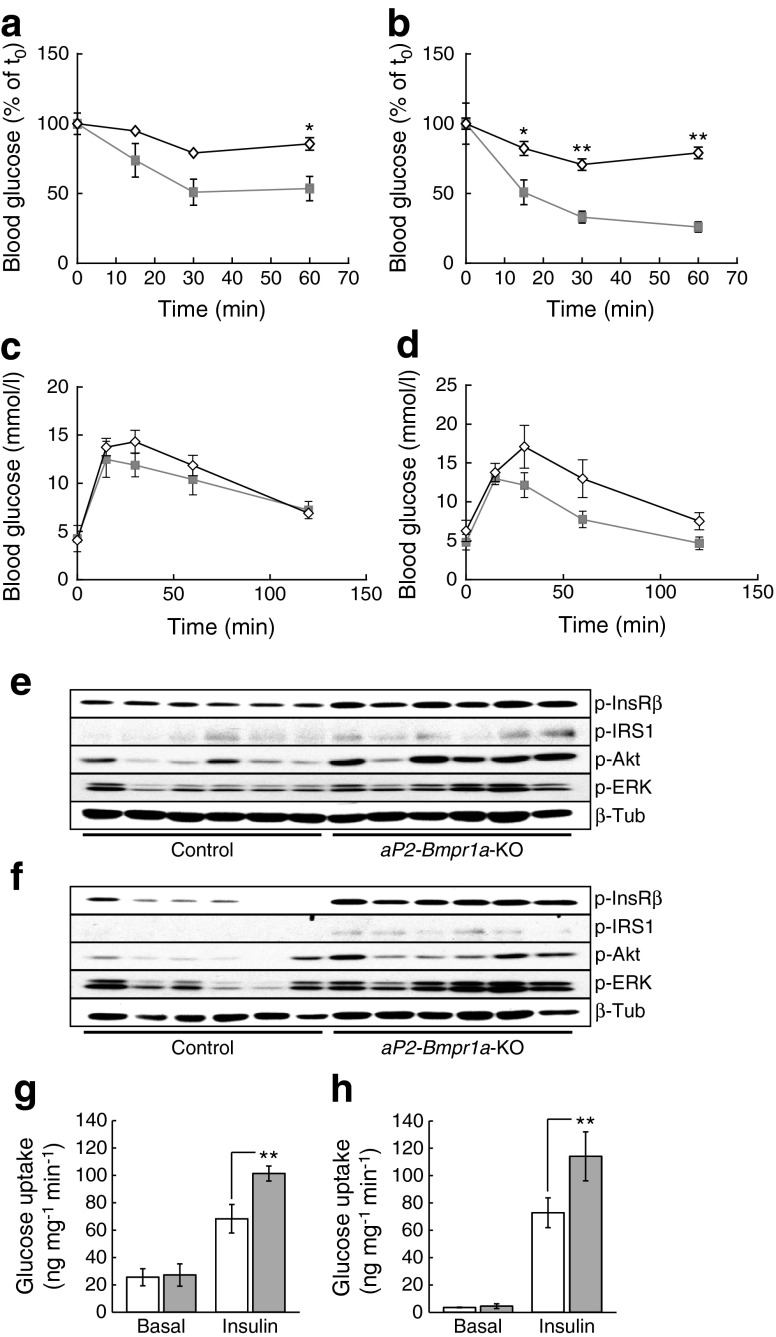
Loss of Bmpr1a in adipose tissue improves insulin sensitivity. (a, b) ITT in 38-week-old mice maintained on a normal chow diet (a) (AUC: p = 0.0286) or in 40-week-old mice maintained on 45%HFD from 4–5 weeks of age (b) (AUC: p = 0.0043). Diamonds, control mice; squares, aP2-Bmpr1a-KO mice. Data are shown as means ± SEM (n = 4 for both groups in a; n = 5 for control and n = 6 for knockout in b). *p < 0.05 and **p < 0.01 compared with control mice (c, d) GTT in 50-week-old mice fed either a normal chow diet (c) (AUC: p = 0.3429) or 45%HFD (d) (AUC: p = 0.6095). Diamonds, control mice; squares, aP2-Bmpr1a-KO mice. Data are shown as means ± SEM (n = 4 for both groups in c; n = 5 for control and n = 6 for knockout in d). (e, f) Western blot analysis of insulin-stimulated activation of the insulin signalling pathway in iWAT (e) and eWAT (f). Levels of the phosphorylated forms of insulin receptor-β (p-InsRβ), insulin receptor substrate (p-IRS)1, protein kinase B (p-Akt) and extracellular-signal regulated kinase (p-ERK) were detected and normalised to basal expression of β-tubulin (β-Tub). Quantification is shown in ESM Fig. 7. (g, h) Unstimulated (Basal) and insulin-stimulated glucose uptake (Insulin) in BAT (g) and tibialis anterior skeletal muscle (h). White bars, control mice; grey bars, aP2-Bmpr1a-KO mice. Data are shown as means ± SEM (n = 7 for basal control; n = 6 for basal knockout; n = 8 for insulin control; n = 6 for insulin knockout). **p < 0.01 compared with control mice

