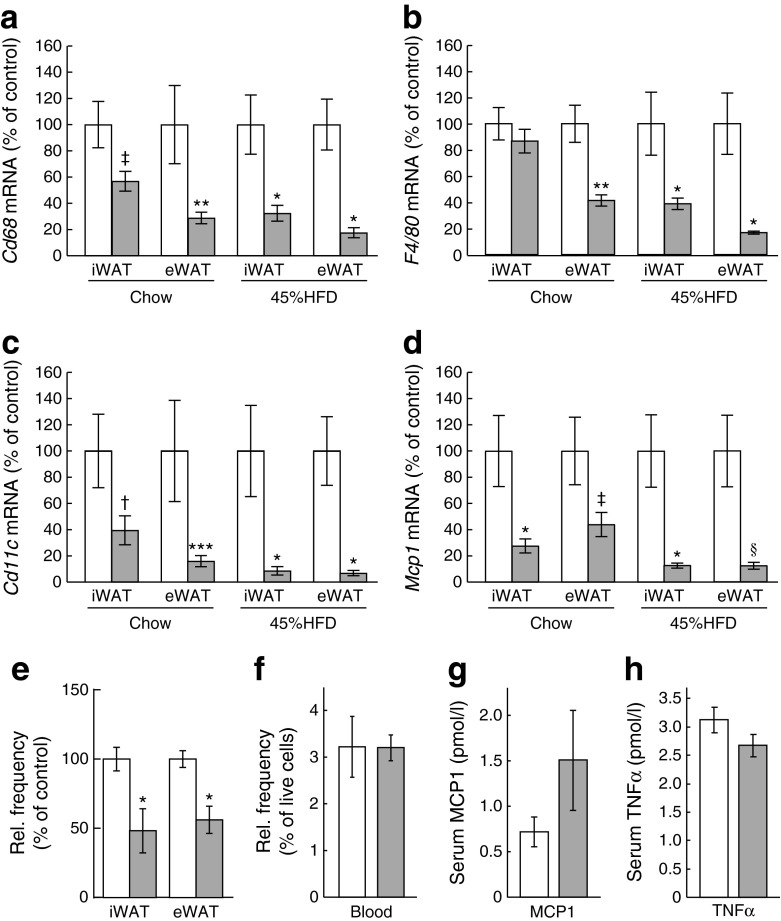
Fig. 2.
Loss of Bmpr1a protects adipose tissue from macrophage infiltration. (a–d) Gene expression analysis of macrophage markers Cd68 (a), F4/80 (b), Cd11c (c) and Mcp1 (d) in iWAT and eWAT of mice maintained on chow diet or 45%HFD until 52 weeks of age. White bars, control mice; grey bars, aP2-Bmpr1a-KO mice. Data are shown as means ± SEM (n = 4–8 mice/group). (e, f) Flow-cytometric analysis of tissue-resident macrophages (surface markers: CD45+;CD11b+; F4/80+;CD3e−;CD19−;CD49b−;Ter119−) in iWAT and eWAT (e) (n = 6 for control and n = 5 for knockout) and circulating monocytes from whole blood (f) (n = 3 for both groups). (g, h) ELISA quantification of serum levels of MCP1 (g) and TNFα (h) (n = 6 for control; n = 4 for knockout). *p < 0.05, **p < 0.01, ***p < 0.001,† p = 0.05, ‡ p = 0.065, § p = 0.067 compared with control mice of the same treatment group and/or tissue type

