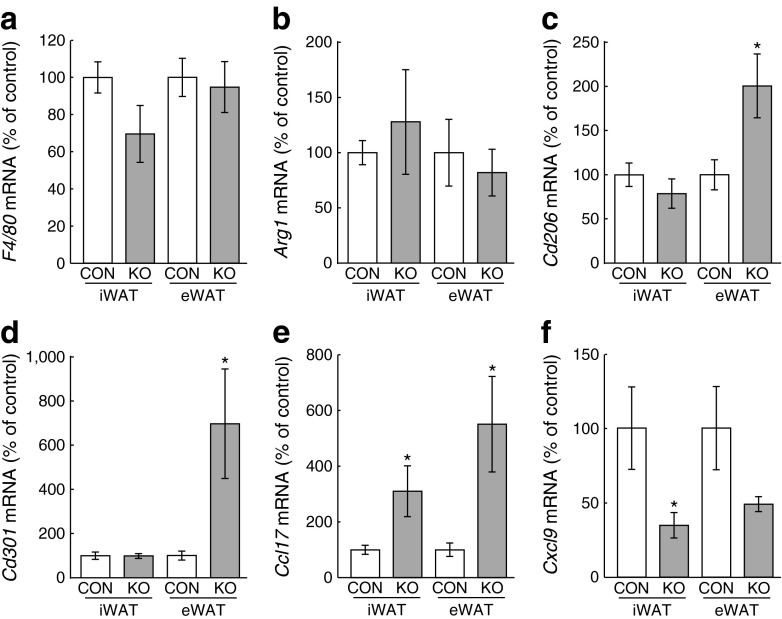
Fig. 3.
Anti-inflammatory polarisation of ATMs in Bmpr1a-deficient adipose tissue. Gene expression analysis of F4/80 (a), Arg1 (b), Cd206 (c), Cd301 (d), Ccl17 (e) and Cxcl9 (f) in FACS-purified macrophages (surface markers: CD45+;CD11b+;F4/80+;CD3e−;CD19−;CD49b−;Ter119−) isolated from mouse iWAT and eWAT. White bars, control mouse macrophages; grey bars, aP2-Bmpr1a-KO mouse macrophages. Data are shown as means ± SEM. Macrophage isolation experiments were repeated with two or three mice/genotype and two or three independent experiments were carried out for mice maintained on an HFD. mRNA yield from sorted macrophages was limited and gene expression data from the individual experiments were pooled for statistical analysis (n = 9 for control and n = 8 for knockout in a, e, and f; control: n = 6 for control and n = 5 for knockout in b–d). *p < 0.05 compared with control mice of the same tissue type

