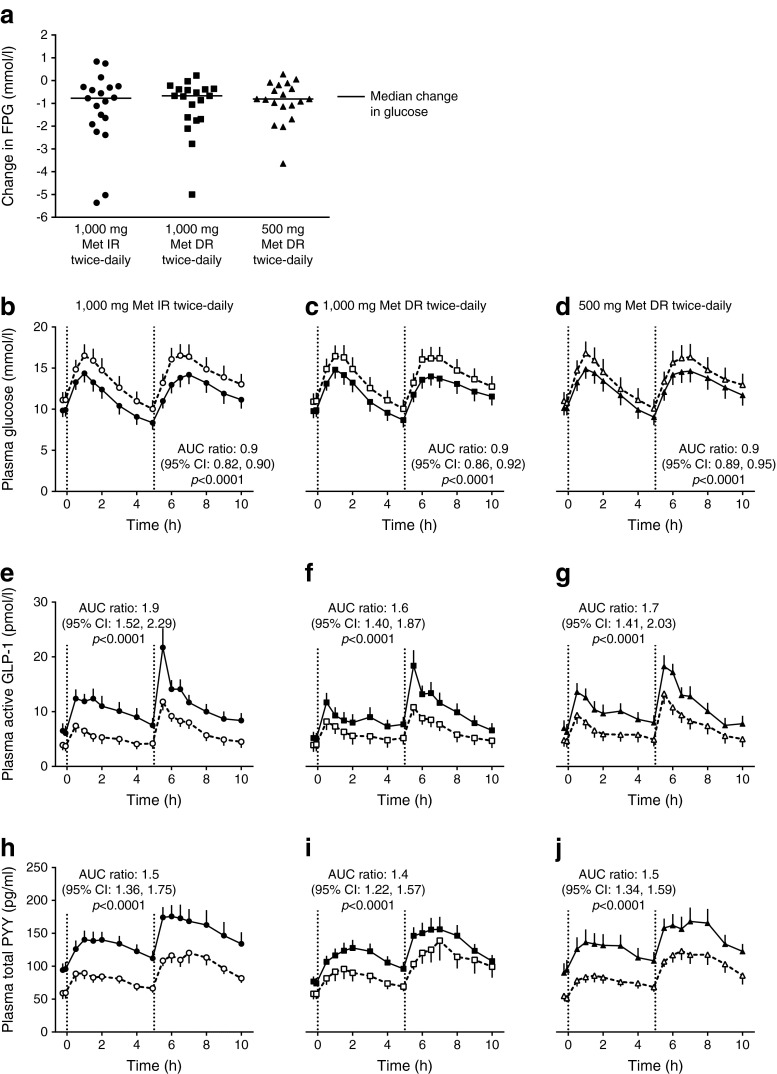
Fig. 2.
Study 1: change in plasma glucose and gut hormone levels. (a) Individual (median) changes from baseline to day 5 in FPG concentrations by treatment. (b–d) Mean and SEM for plasma glucose at baseline and day 5. (e–g) Mean and SEM for plasma GLP-1 active at baseline and day 5. (h–j) Mean and SEM for PYY total at baseline and day 5. White symbols, values at baseline; black symbols, values at day 5. Evaluable population, n = 19. All treatments were administered at t = −1 min relative to the standardised breakfast (t = 0 h) and lunch (t = 5 h; dotted vertical lines). Met, metformin

