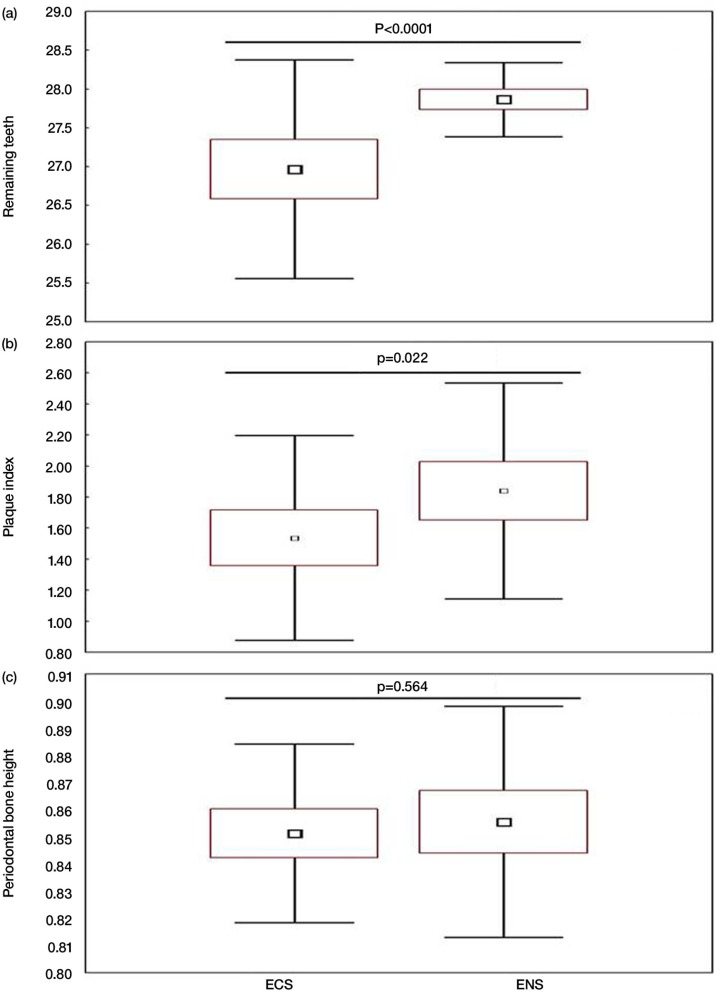
Fig. 1.
Remaining teeth, plaque index, and periodontal bone height of the study groups: exclusive narghile smokers (ENS, n=60) and exclusive cigarettes smokers (ECS, n=60). (a) Remaining teeth. (b) Plaque index. (c) Periodontal bone height. Data are shown as box-and-whisker plots. Small rectangle: mean; large rectangle: 95% CI; error bars: standard deviation. p (Student's t-test): ENS versus ECS.

