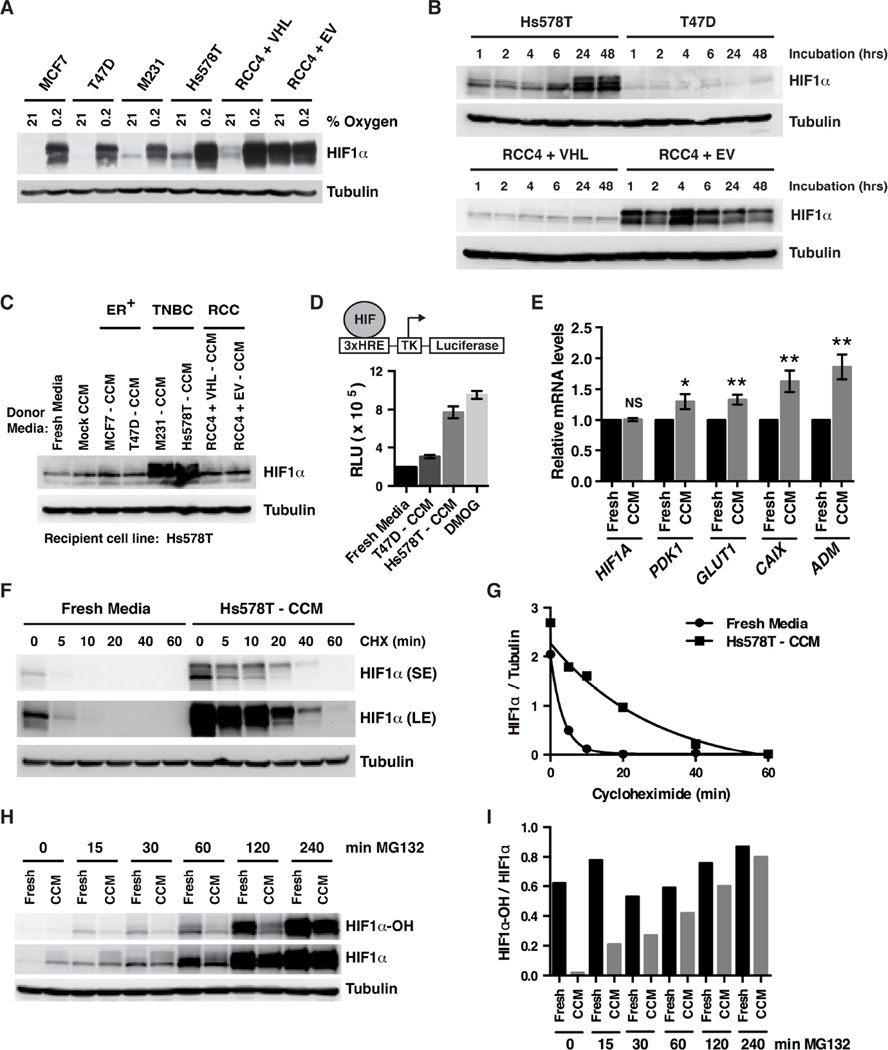
Figure 2. TNBC Cells Secrete a Small Molecule HIF1α Stabilizer.
(A) Immunoblot analysis of breast [MCF7, T47D, MDA-MB-231 (M231) and Hs578T] and renal (RCC4) cancer cell lines cultured in the presence of 21% oxygen or 0.2% oxygen for 6 hrs.
(B) Immunoblot analysis of breast (Hs578T and T47D) and renal (RCC4) cancer cell lines at the indicated timepoints after being plated in fresh media.
(C) Immunoblot analysis of Hs578T cells exposed for 6 hours to fresh media or media either incubated for 48 hours in the absence of cells (Mock) or conditioned by the indicated breast [MCF7, T47D, MDA-MB-231 (M231), Hs578T] or renal (RCC4) cell lines. CCM = cell-conditioned media.
(D) Luciferase activity of Hs578T cells expressing firefly luciferase (FLuc) under the control of a HIF-responsive promoter (3xHRE) after 6 hours exposure to fresh media, media conditioned by the indicated cell lines or fresh media supplemented with 1 mM DMOG. Data are represented as mean ± SEM.
(E) Real-time PCR analysis of Hs578T cells cultured in either HS578T-conditioned media or fresh media for 6 hours. Transcript levels were normalized to ACTB, and then to the corresponding value for “Fresh Media.” Data are represented as mean ± SEM. NS refers to not statistically significant, * refers to p-value < 0.05, ** refers to p-value < 0.01.
(F and H) Immunoblot analysis of Hs578T cells grown in fresh media or Hs578T-CCM. 100 µg/mL Cycloheximide (F) or 10 µM MG132 (H) was added for the indicated duration before cell lysis.
(G and I) Quantification of band intensities from (F and H).
See also Figure S2.

