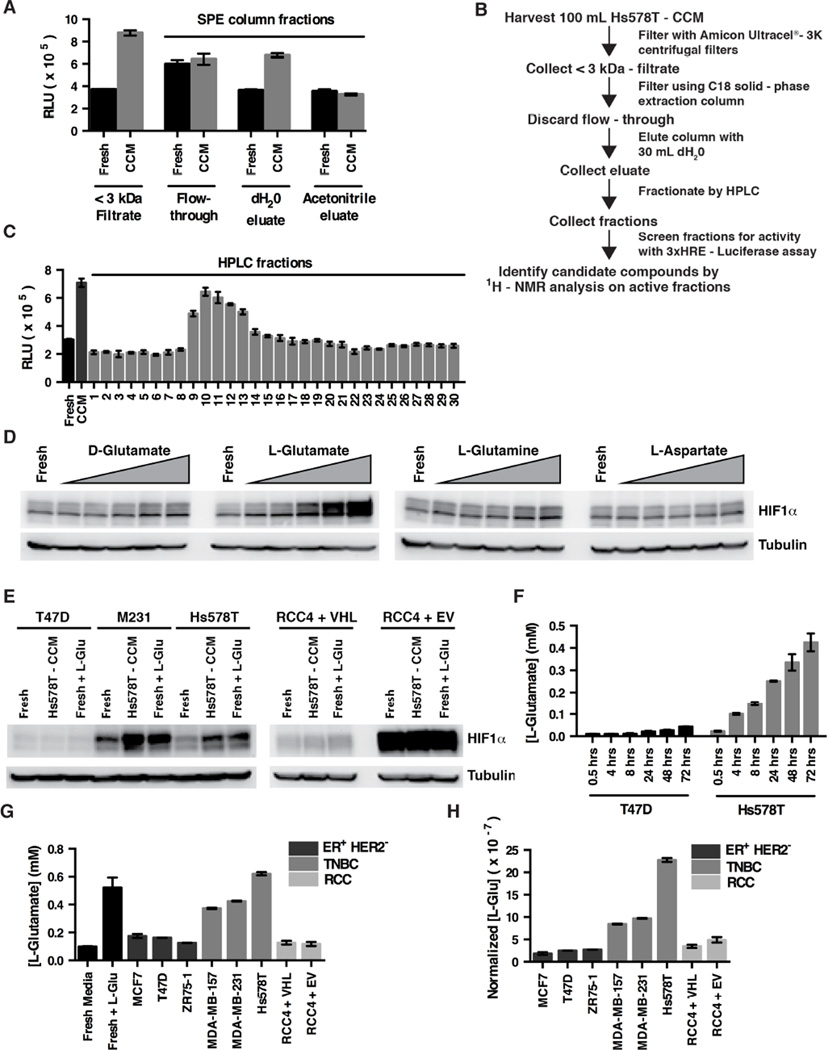
Figure 3. L-Glutamate Secreted by TNBC is Sufficient to Induce HIF1α.
(A and C) FLuc activity of Hs578T cells expressing FLuc under the control of the 3xHRE promoter after 6 hours exposure to the indicated partially purified fractions derived from Hs578T-CCM. Panel (A) shows data from the SPE-column elutions. Panel (C) shows data from the HPLC fractions. Data are represented as mean ± SEM. (B) Schema for purifying HIF1α-inducing factor from Hs578T-CCM.
(D) Immunoblot analysis of Hs578T cells grown for 4 hours in fresh standard culture media (containing 4 mM L-glutamine and 0.2 mM L-cystine) supplemented with increasing concentrations of the indicated amino acids. Triangle indicates 0.075, 0.15, 0.3, 0.6, and 1.2 mM.
(E) Immunoblot analysis of breast [T47D, MDA-MB-231 (M231), Hs578T] and renal (RCC4) cancer cell lines cultured in fresh media, Hs578T-CCM, or fresh media supplemented with 0.6 mM L-glutamate.
(F) L-glutamate concentrations in cell culture media conditioned by T47D cells or Hs578T cells for the indicated timepoints. Data are represented as mean ± SEM.
(G and H) L-glutamate concentrations in cell culture media conditioned by the indicated cell lines for 72 hours. Fresh media (Fresh) or fresh media supplemented with 0.6 mM L-glutamate (+L-Glu) serve as controls. Cells were plated in order to achieve similar confluence at 72 hours. In (H) data were normalized to cell number. Data are represented as mean ± SEM.
See also Figure S2.

