
Fig. 3.
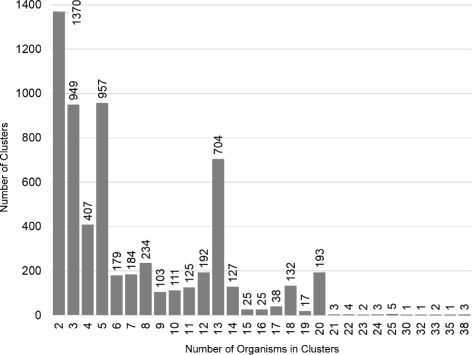
Multiplicity plot of homologous gene clusters along the tick-axis. The bars represent the number of gene/protein clusters that are comprised of the number of tick-transmitted species represented on the x-axis, e.g., the rightmost bar indicates that there are 38 tick transmissible species that have three clusters in common (also see Additional file 3: Figure S2)