
Fig. 3.
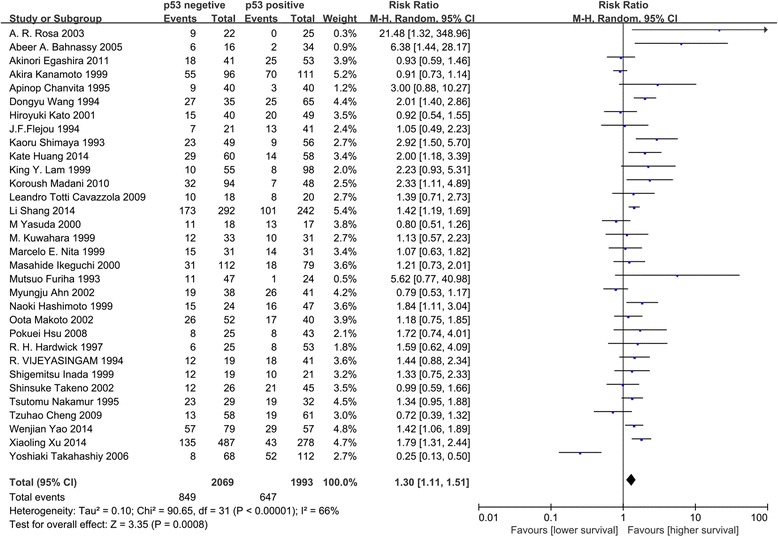
Analysis of p53 expression and survival of EC patients. Forest plot of RR for the OS included studies. Combined RR was calculated by a random model
Official websites use .gov
A
.gov website belongs to an official
government organization in the United States.
Secure .gov websites use HTTPS
A lock (
) or https:// means you've safely
connected to the .gov website. Share sensitive
information only on official, secure websites.
Analysis of p53 expression and survival of EC patients. Forest plot of RR for the OS included studies. Combined RR was calculated by a random model