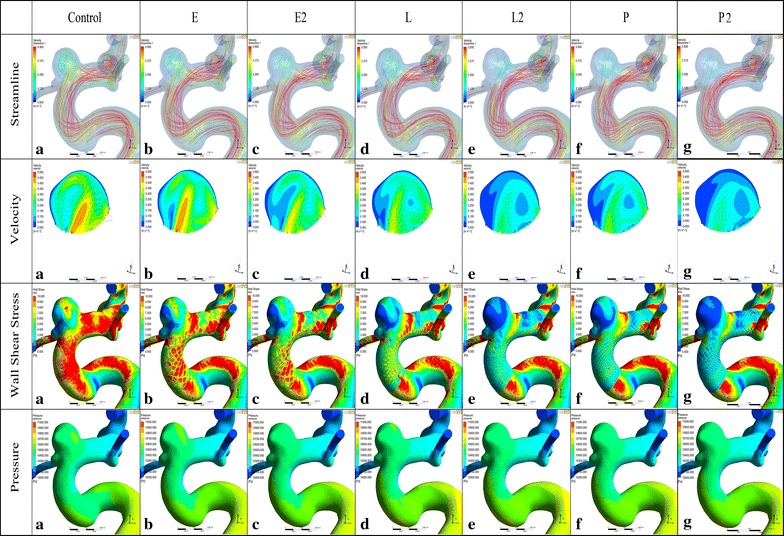
Fig. 4.

Visualized results of numerical simulation (Streamline, Velocity, WSS and Pressure) of Case 1. E, a single-Enterprise stent model; E2, double-Enterprise stent model; L, a single-LVIS stent model; L2, double-LVIS stent model; P, a single- Pipeline device model. E caused only a small change in the overall intra-aneurysm flow pattern compared with Control. L produced a more obvious flow reduction than E2. With additional LVIS stent deployment, further reduction was achieved which was more than that of P. While P2 showed the most evident WSS and flow velocity reduction compared with other single and double stent models. The vortex shape seen in Control persists with the gradually lower intensity after stenting similar to the WSS and velocity changes. The WSS of the parent vessel decreased as one goes from E to L2. While the L2 showed a bigger WSS decrease than P. Note: WSS wall shear stress
