
Fig. 2.
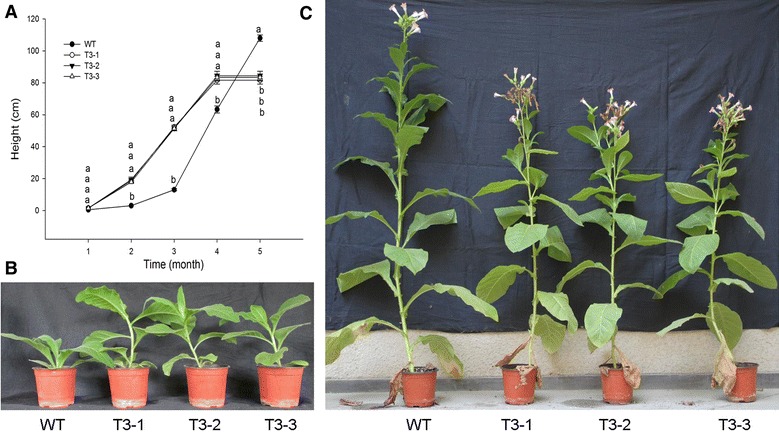
Phenotypic variation of wild-type (WT) and transgenic plants at different developmental stages. A Variation in the height of WT and transgenic plants at different developmental stages, each line is the mean of five replicates. Different letters indicate statistically significant differences at P ≤ 0.05, B eight-leaf period, and C filling period