
Fig. 3.
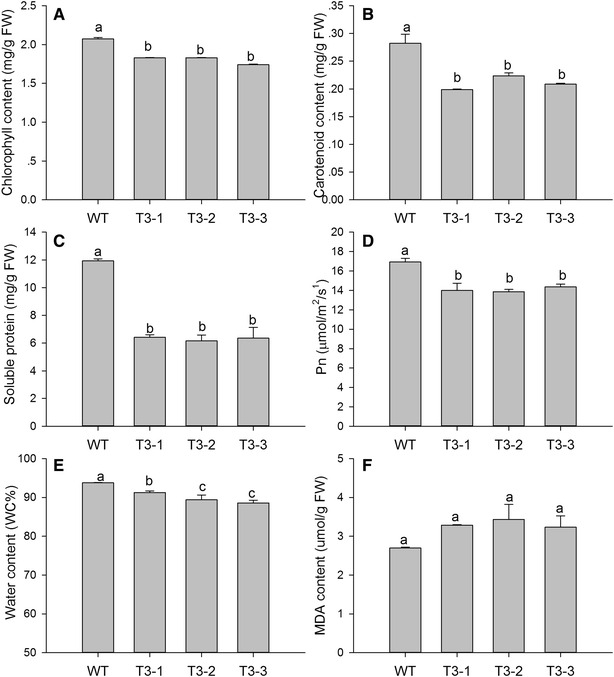
Measurement of senescence-related physiological parameters in WT and transgenic plants. A Chlorophyll content, B carotenoid content, C soluble protein content, D net photosynthetic rate, E shows water content, and F signifies malondialdehyde (MDA) content. Data are mean ± SE (n = 5, five biological replicates per line). Different letters indicate statistically significant differences at P ≤ 0.05